Using continuous glucose
monitoring
This chapter provides information on how to use CGM on your pump and view
your sensor glucose data. This information helps you identify sensor glucose
trends, including being notified if your sensor glucose is falling or rising rapidly.
You can also view historical sensor glucose readings in a graph format. Information
is also included on how to silence your glucose alerts.
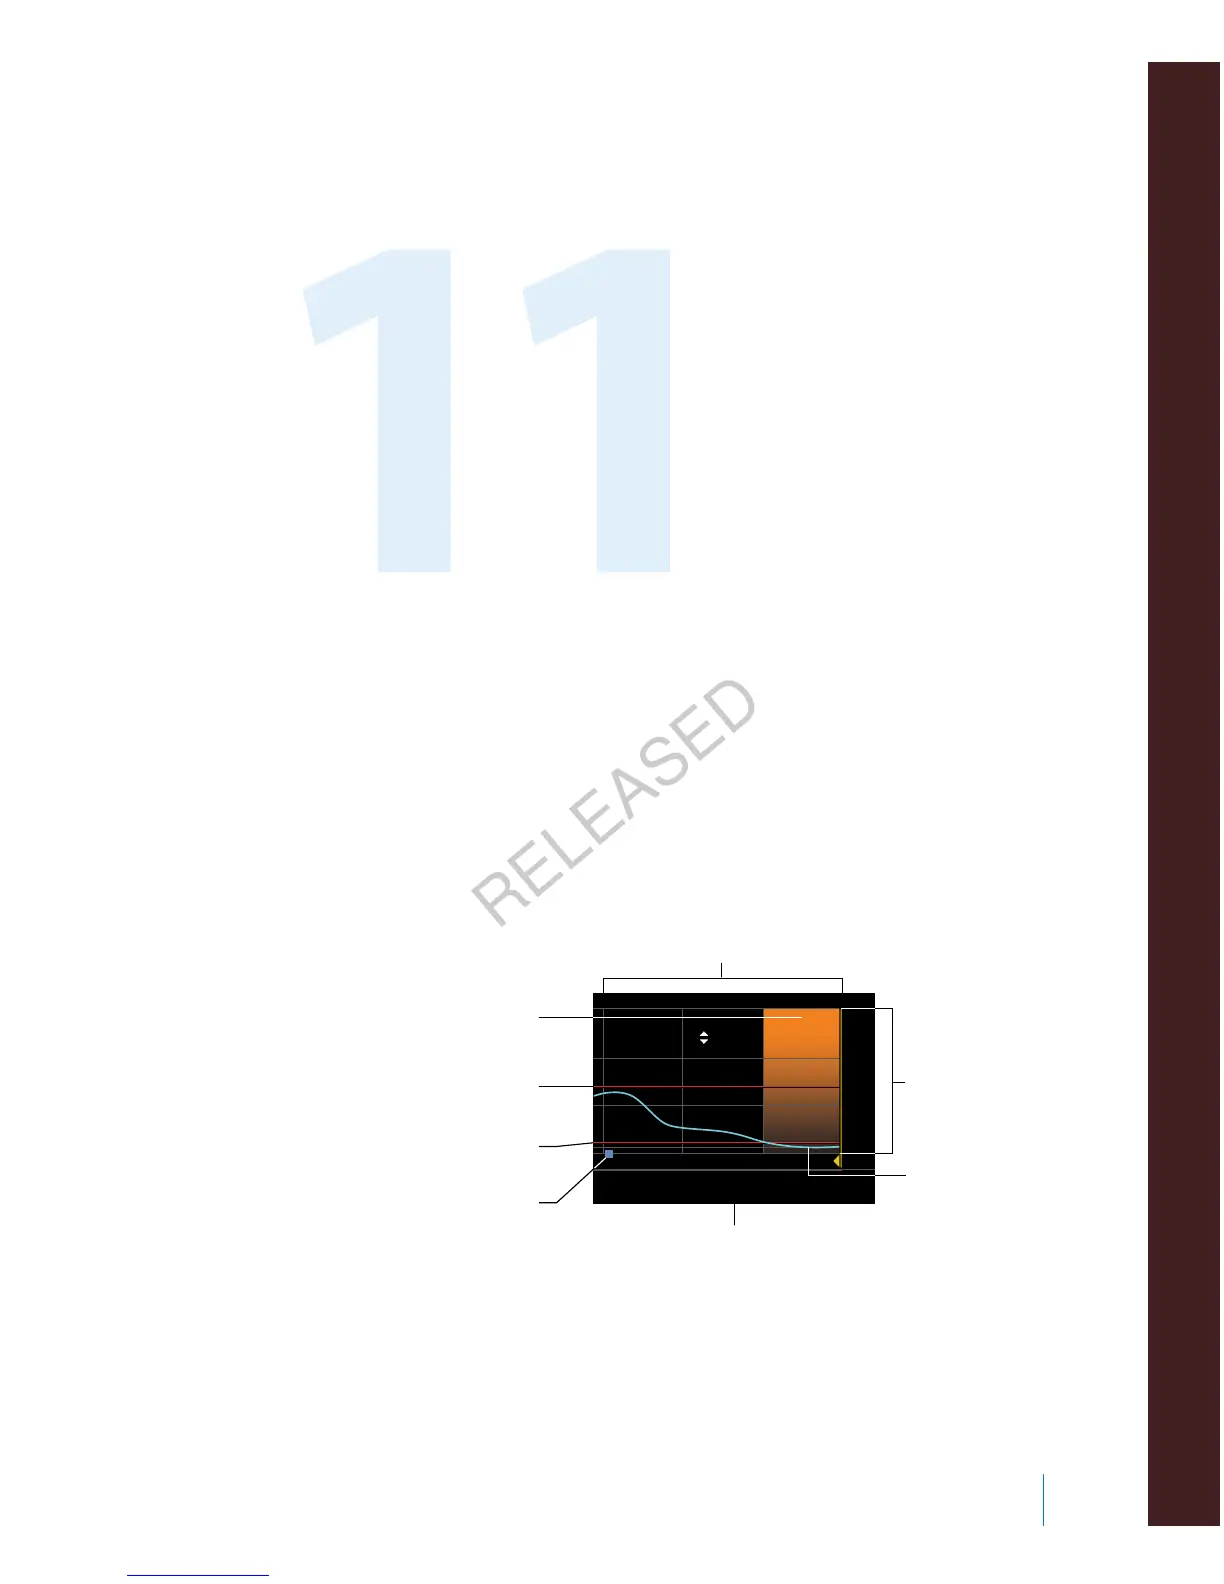
The sensor graph
The sensor graph displays your current sensor glucose (SG) reading that is
wirelessly sent to your pump by the transmitter.
678
20
15
10
5
2.2
mmol/L
8.3 mmol/L, 09:00
3 hr
9
SG values
high limit
selected
reading or event
SmartGuard
suspend by sensor
time
low limit
bolus marker
continuous
SG reading
The sensor graph includes the following information:
• The most recent sensor glucose reading
Using continuous glucose monitoring 191
■
using continuous glucose monitoring
MP6025957-024 / A
RELEASED