USER MANUAL NOVAplus
MRU GmbH, D-74172 Neckarsulm 46 / 95
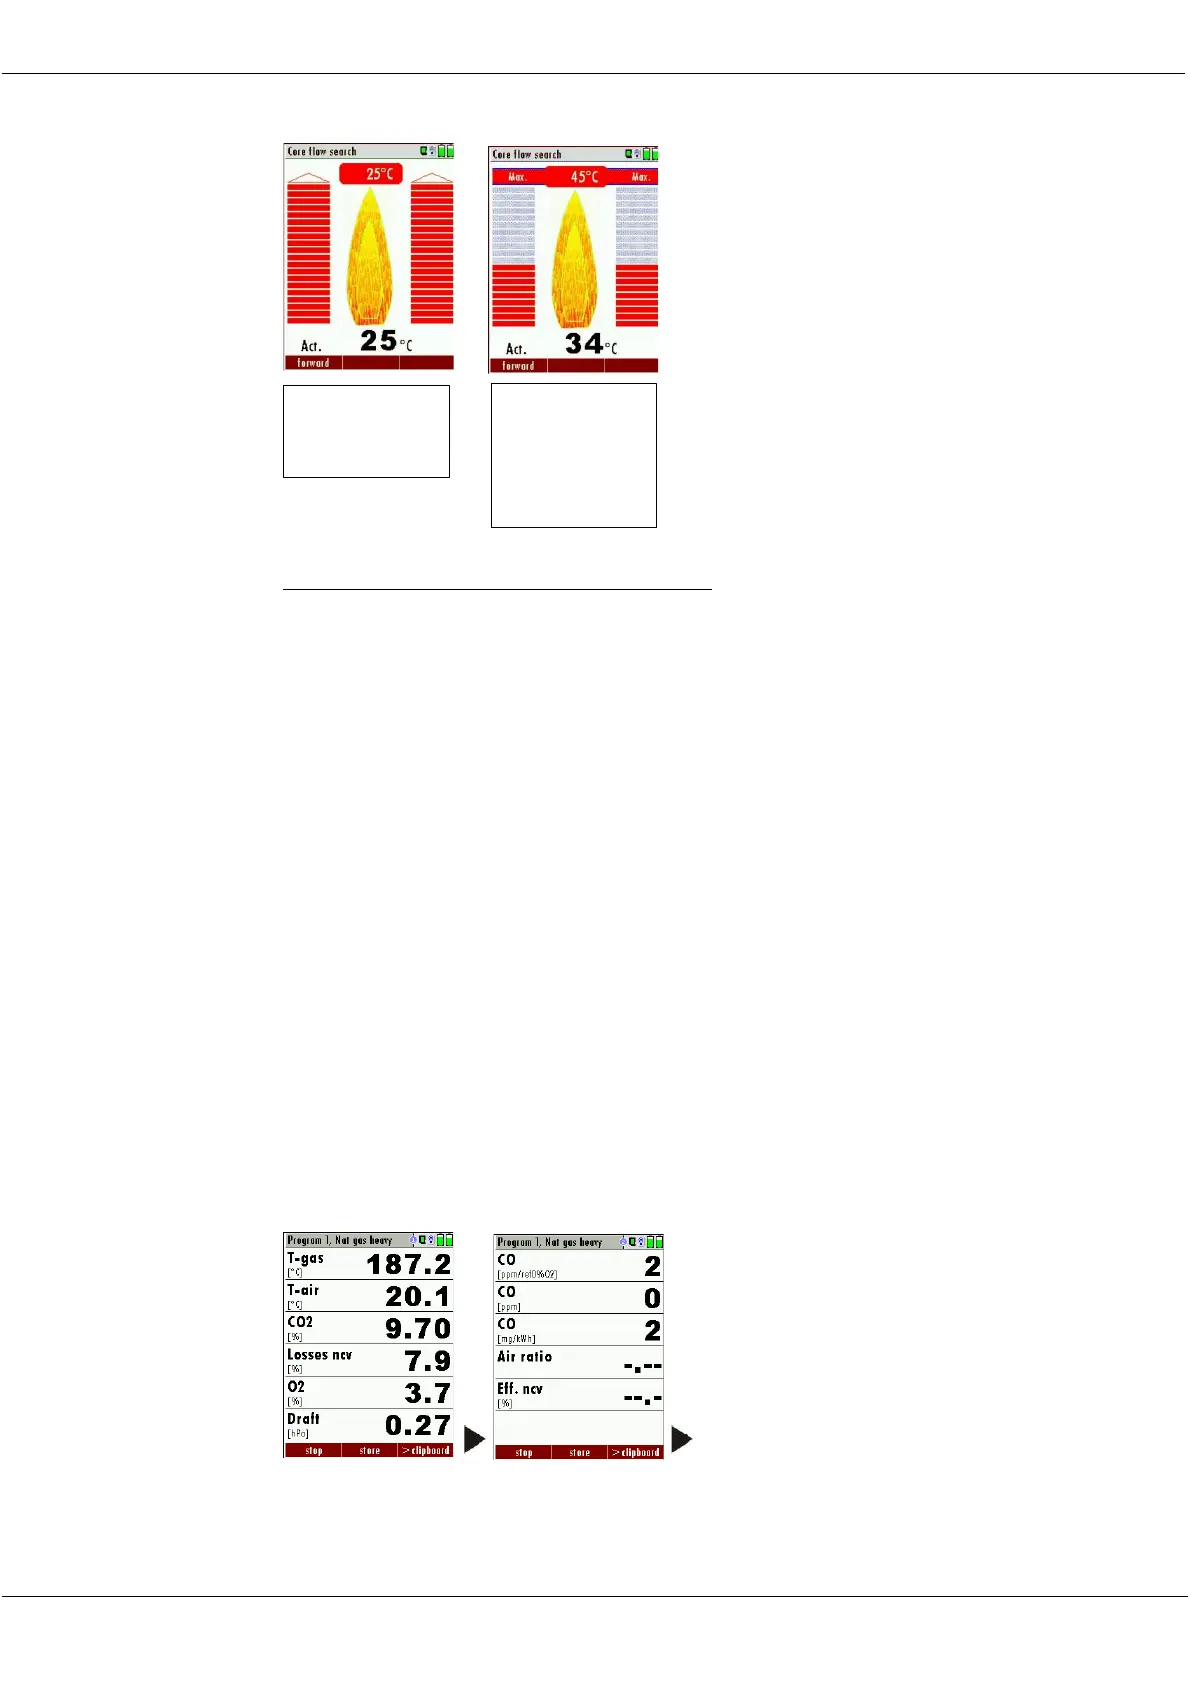
Positioning the probe in the core flow
Insert the probe pipe slowly into the stack and position your probe pipe
when you have reached the maximum flue gas temperature that is dis-
played (see temperature maximum value on the display – in this case
34°C).
Maximum temperature has been reached when the arrows (left picture)
disappear, max. (right picture) appears in place of the arrow, and the
beeper signal stops. Moving away from the max. temperature will result
in the bars moving away from the max. temperature (1 bar is equivalent
to 1°C). Once the right core flow has been achieved, the probe is fixed
with the probe cone screw.
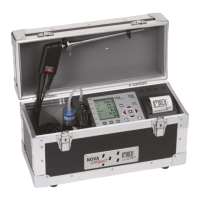
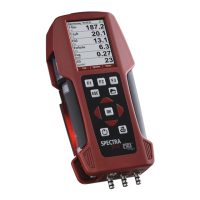
7.3. Measured value display
After the core flow search you will see the measurement values on the
display.
Measurement values can be organized on three pages, each page dis-
playing 6 measurement values.
See also chapter 5.12 Defining measurement window, Page 37.