119
How they work:
Rapid light curves are created by dark adapting samples for a specific period of time and
stepping a photosynthesis driving actinic light source for short specific periods of time at
specific intensities. The light source is usually built into the fluorometer and the sample
is shrouded to allow only the actinic light from the fluorometer to hit the sample. Steps
may be up or down. Typically, after a short period of time at a specific actinic light level,
a single saturation pulse is triggered and the internal light.
Relative ETR is calculated using a Quantum photosynthetic yield of PSII measurement,
taken at a given light level, and using the equation: rETR = (Quantum photosynthetic
yield of PSII ) x (PAR - the light level ) x ( 0.84) x (0.5). rETR is scaled on the Y axis,
and PAR (photosynthetically active radiation per meter squared per second) is on the X
axis. It is common for the first measurement to be made in the dark and the second step at
a low PAR level. It is also common for successive steps to be measured at higher light
levels with the last step or two steps being measured at or above the leaf light saturation
levels. Intensity values are commonly equally spaced.
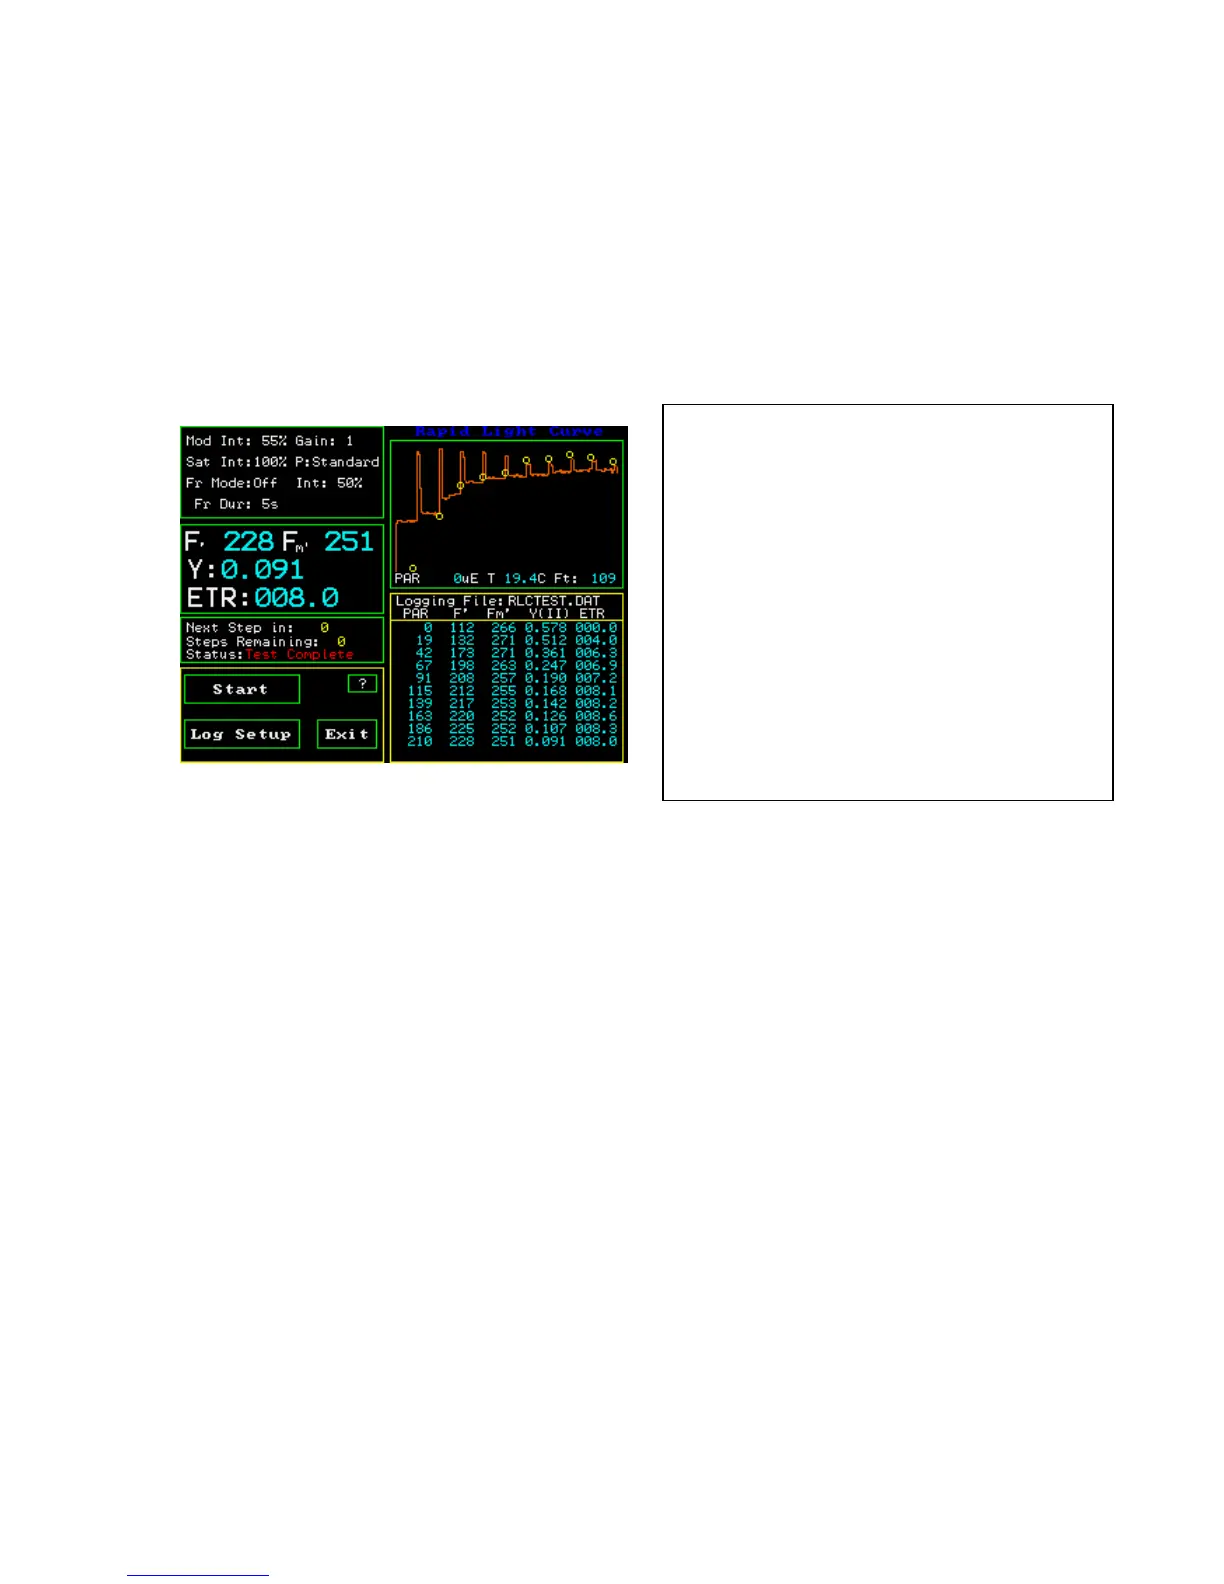
Typical trace of a rapid light curve (Shade leaf)
The yield and ETR values for each step are reported
on the same screen and in the measuring file. The
orange trace represents the actual fluorescence
intensity. The spikes represent the saturation flashes
and Fm’ values, while the lower values, at each
step, represents the fluorescence output at each
actinic light step F’. Y(II) or yield is
(Fm’-F)/Fm’. Y(II) declines as actinic light step
intensity increases. The Yellow circles represent
relative electron transport rate or relative ETR. The
first circle on the lower left is a dark-adapted zero
value. The F’ value for the first measurement
shown in blue, in the lower right hand window, is
the modulated light intensity, not the actinic light
intensity.