98
Relative Electron Transport Rate
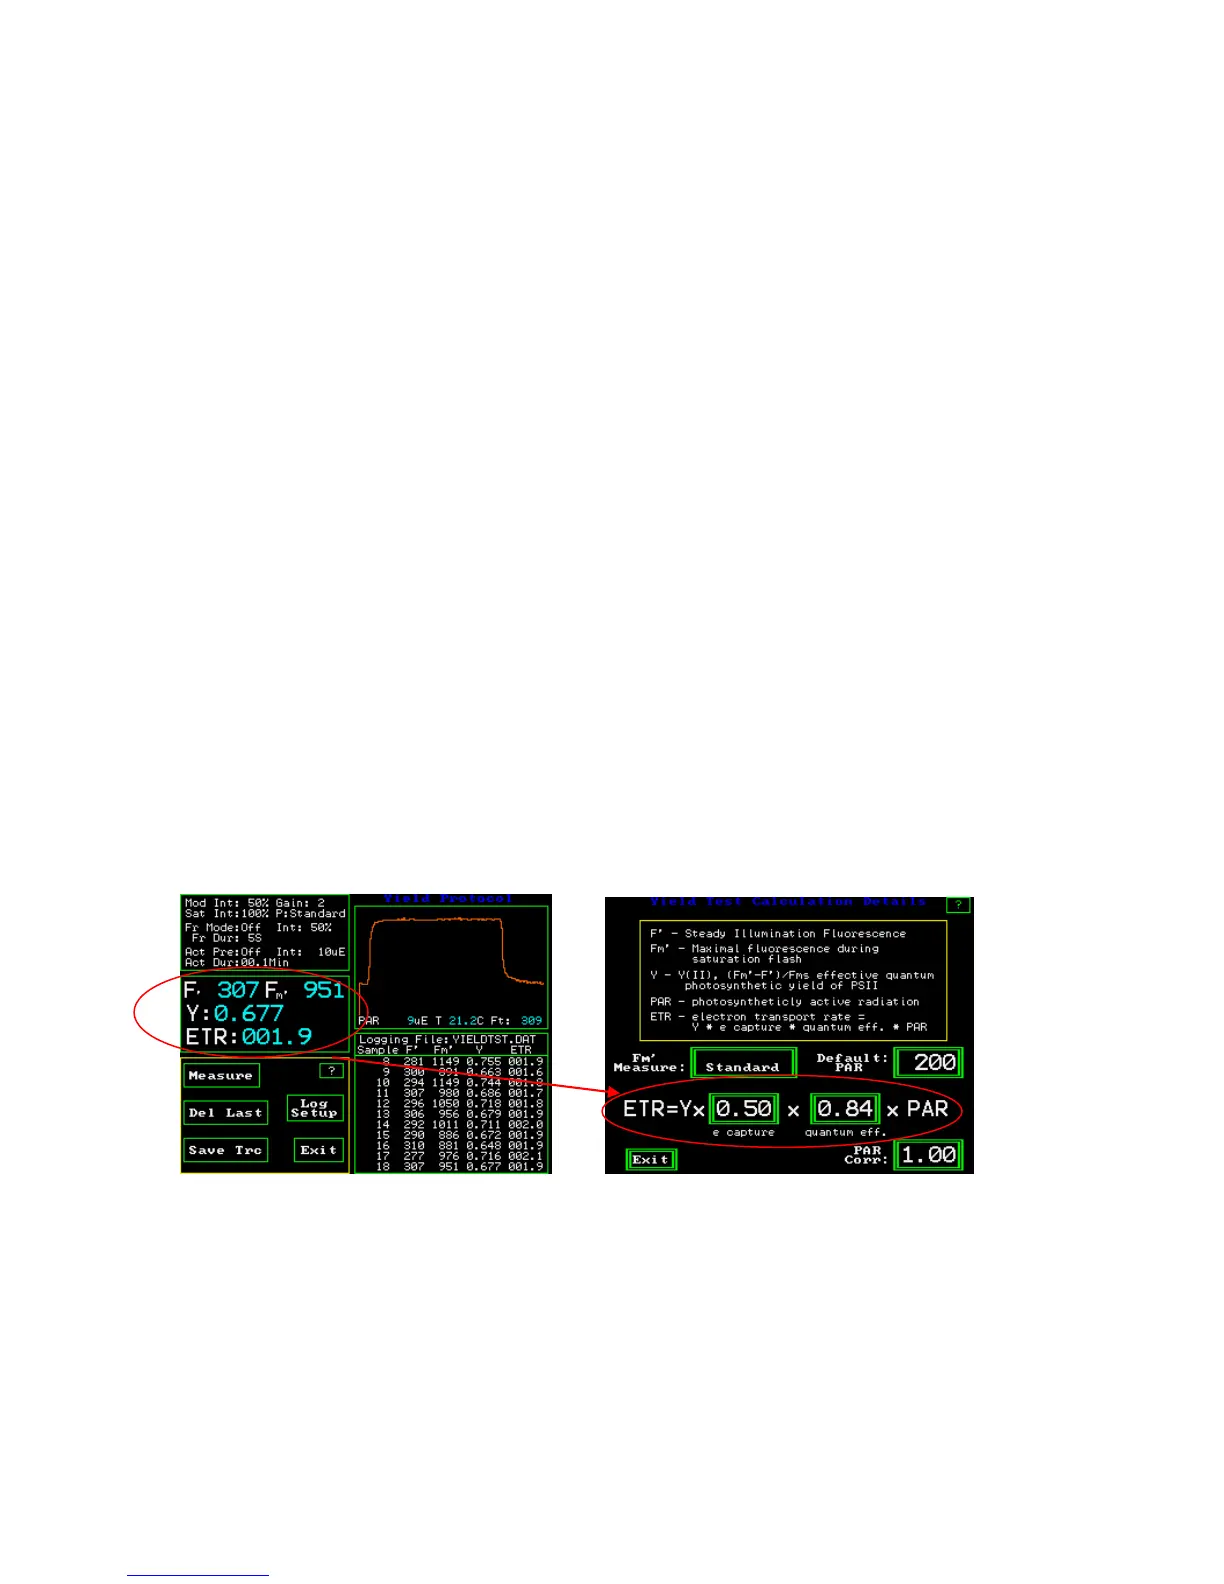
Relative Electron Transport Rate - ETR :mols = (Yield) (PAR) (.84) (.5)
(quantum yield of PSII) (measured Photosynthetically Active Radiation measured in
:mols quanta m
-2
s
-1
.)( leaf absorption coefficient)(fraction of absorbed light by PSII
antennae)
Average plant values are used in the standard equation. 0.84 is a good average value for
many species of plants (Bjorkman and Demming, 1987). Research has shown that the
leaf absorption coefficient can vary between 0.7 and 0.9 (Eichelman H. 2004), with
species, chlorophyll content, and water content. Research has also shown that the fraction
of light that is absorbed by PSII varies by species and can range from at least .40 to .60
(Laisk and Loreto, 1996). Even if the default average values are used, ETR can provide
useful relative comparative information between different samples and the same sample
under different conditions.
e capture and quantum eff – setting leaf absorption & PSII ratio
As stated above, the default settings in the ETR equation are considered to be average
plant values for relative comparison of measurements. “e capture” is the ratio of PSII
reaction centers to PSI reaction centers, and “quantum eff” is the ratio of light absorbed
by the leaf to the amount irradiated on the leaf, at leaf level. The actual values for these
parameters can be inserted into the ETR if they are wanted. The ratio of PSII reaction
centers can be changed in the equation by pressing “e capture” and using the key board
screen. Similarly, the over all leaf absorption can be changed by pressing “quantum eff”.
Baker (2008) recommends using a integrating sphere to measure leaf absorption values
for more exacting requirements.
Y(II) Measuring Screen Y(II) Test Calculation Details Screen
For more exact ETR values, refer to papers listed above. The ratio of PSII reaction
centers to PSI reaction centers change with plant species and type. The number of PSII
reaction centers tends to be lower in C
4
plants than in C
3
plants (Laisk and Loreto,1996).
This correction is not needed for most relative comparison ETR applications; however, it
has been made available for people that need it.