120
Curve fitting software
The data can be put into Sigmaplot software where a regression wizard can use a curve
fitting model to determine Cardinal points for analysis. (Ralph 2005) Web address for
Sigmaplot software:
http://www.sigmaplot.com/products/sigmaplot/sigmaplot-details.php .
Cardinal points are then derived from equations determined by the curve model of the
researcher’s choice. Jassby and Platt (1976), Platt (1980)and Eilers and Peeters (1988) have
been used.
Cardinal points description
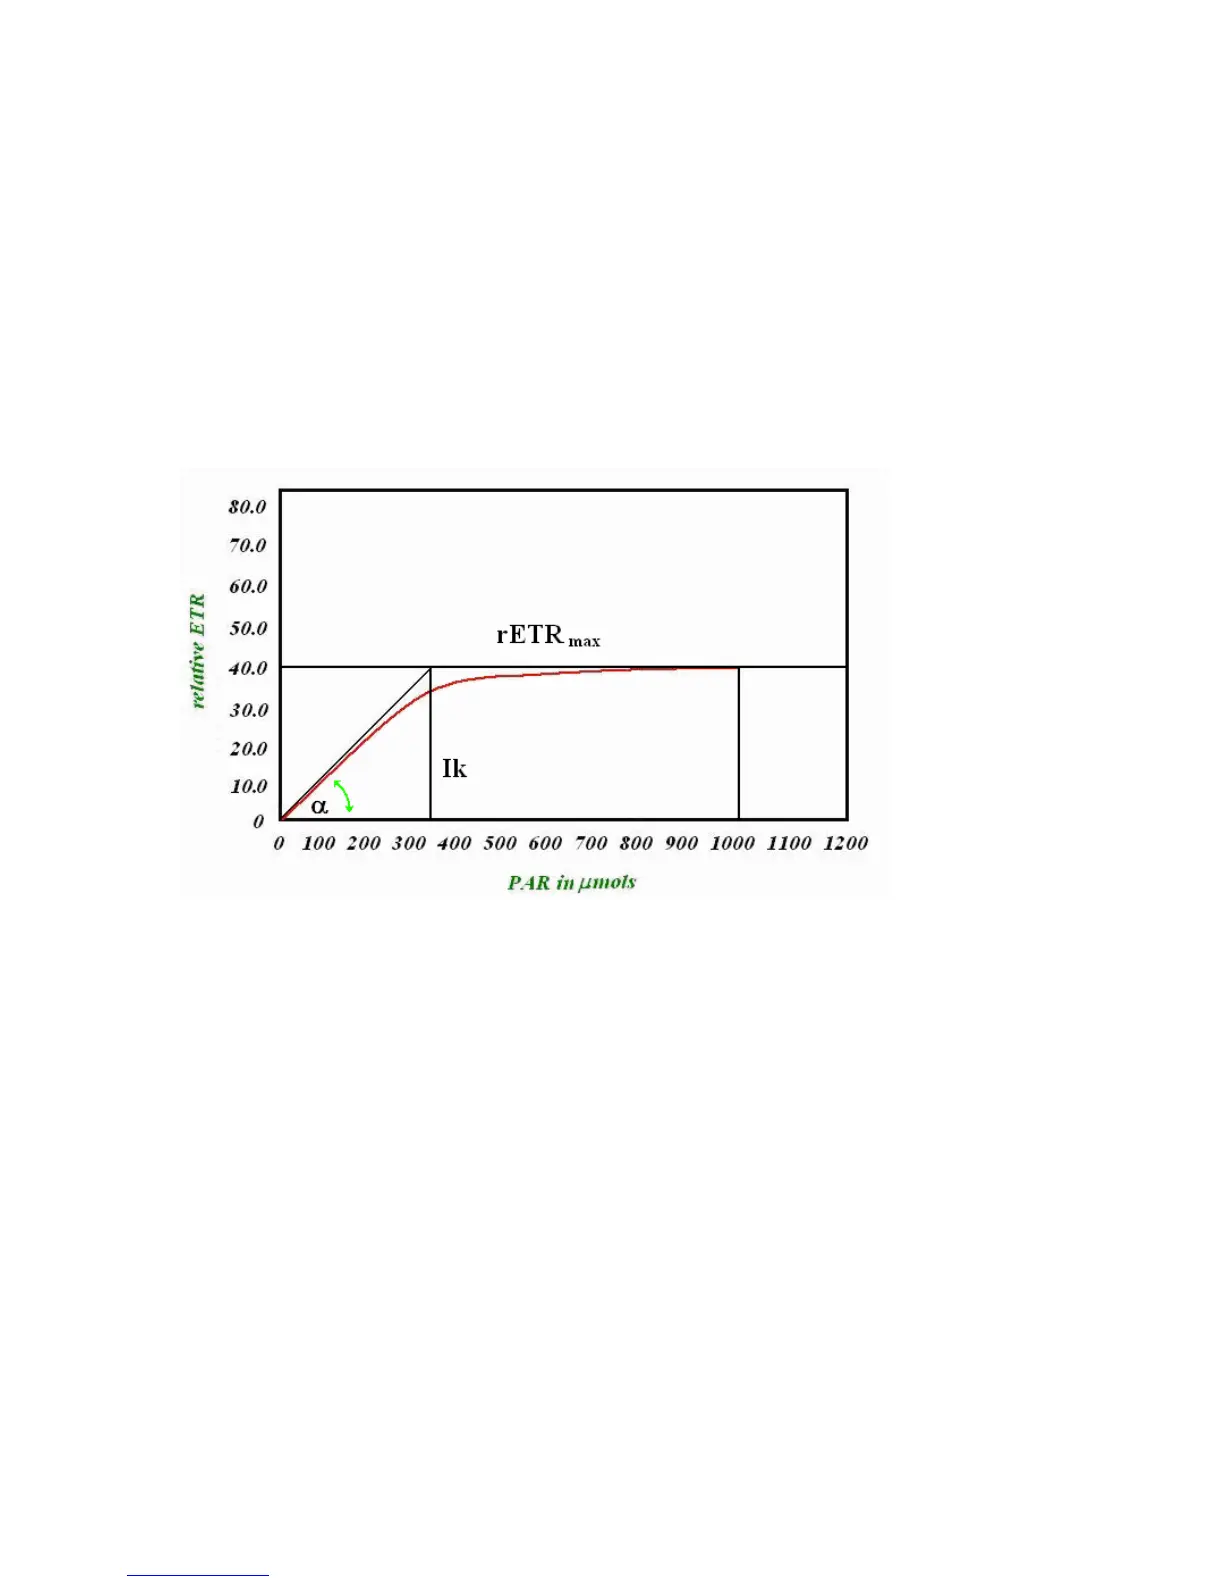
α is the initial slope of line at low PAR values created by relating ETR to PAR. It
provides a measure of quantum efficiency(Schreiber 2004)
ETRmax is a measure of a leaf’s photosynthetic capacity or maximum electron transport
rate (Schreiber 2004).
Ik = α/ETRmax is a measurement of the point where light saturation dominates, or the
minimum saturation level (Schreiber 2004). (Ik is also called Ek in some literature (Ralph
2005)) According to Ralph (2005), the initial slope of the curve " is proportional to
efficiency of light capture. While photochemical quenching predominates before Ik, non-
photochemical quenching dominates after Ik.
After the RLC reaches the peak value, any decline in ETR is related to down regulation
and not photoinhibition (Ralph 2005).