171
Appendix D • Data Formats
Overview
Each test has a unique data output format, tailored to the changing measured parameters. The differences
between the data groups are listed in this section. Measurement values are represented in a spread sheet
format and intensity trace data is presented in a vertical sequential list of intensity values. Traces may be
graphed in Excel or other spread sheet products.
Data exists in two forms in the OS1p. The first type is the fluorescence signal over the course of a test.
This "raw data" is useful when visualizing what is happening dynamically in photosystem II, as it is
exposed to the different illumination sources over the course of the test. The second kind of data is the
tabular data that is generated around the saturating pulses. The specifics of each of these parameters are
mentioned later in this section. Storage method varies between these two types of data. The “raw data” for
a trace is allotted a unique storage or row number based on the next open location in the storage directory,
as they are saved. The user can not specify which slot number a trace is stored to. The "Tabulated Data",
on the other hand, is stored in logical groupings called file numbers. Unlike traces, the current file number
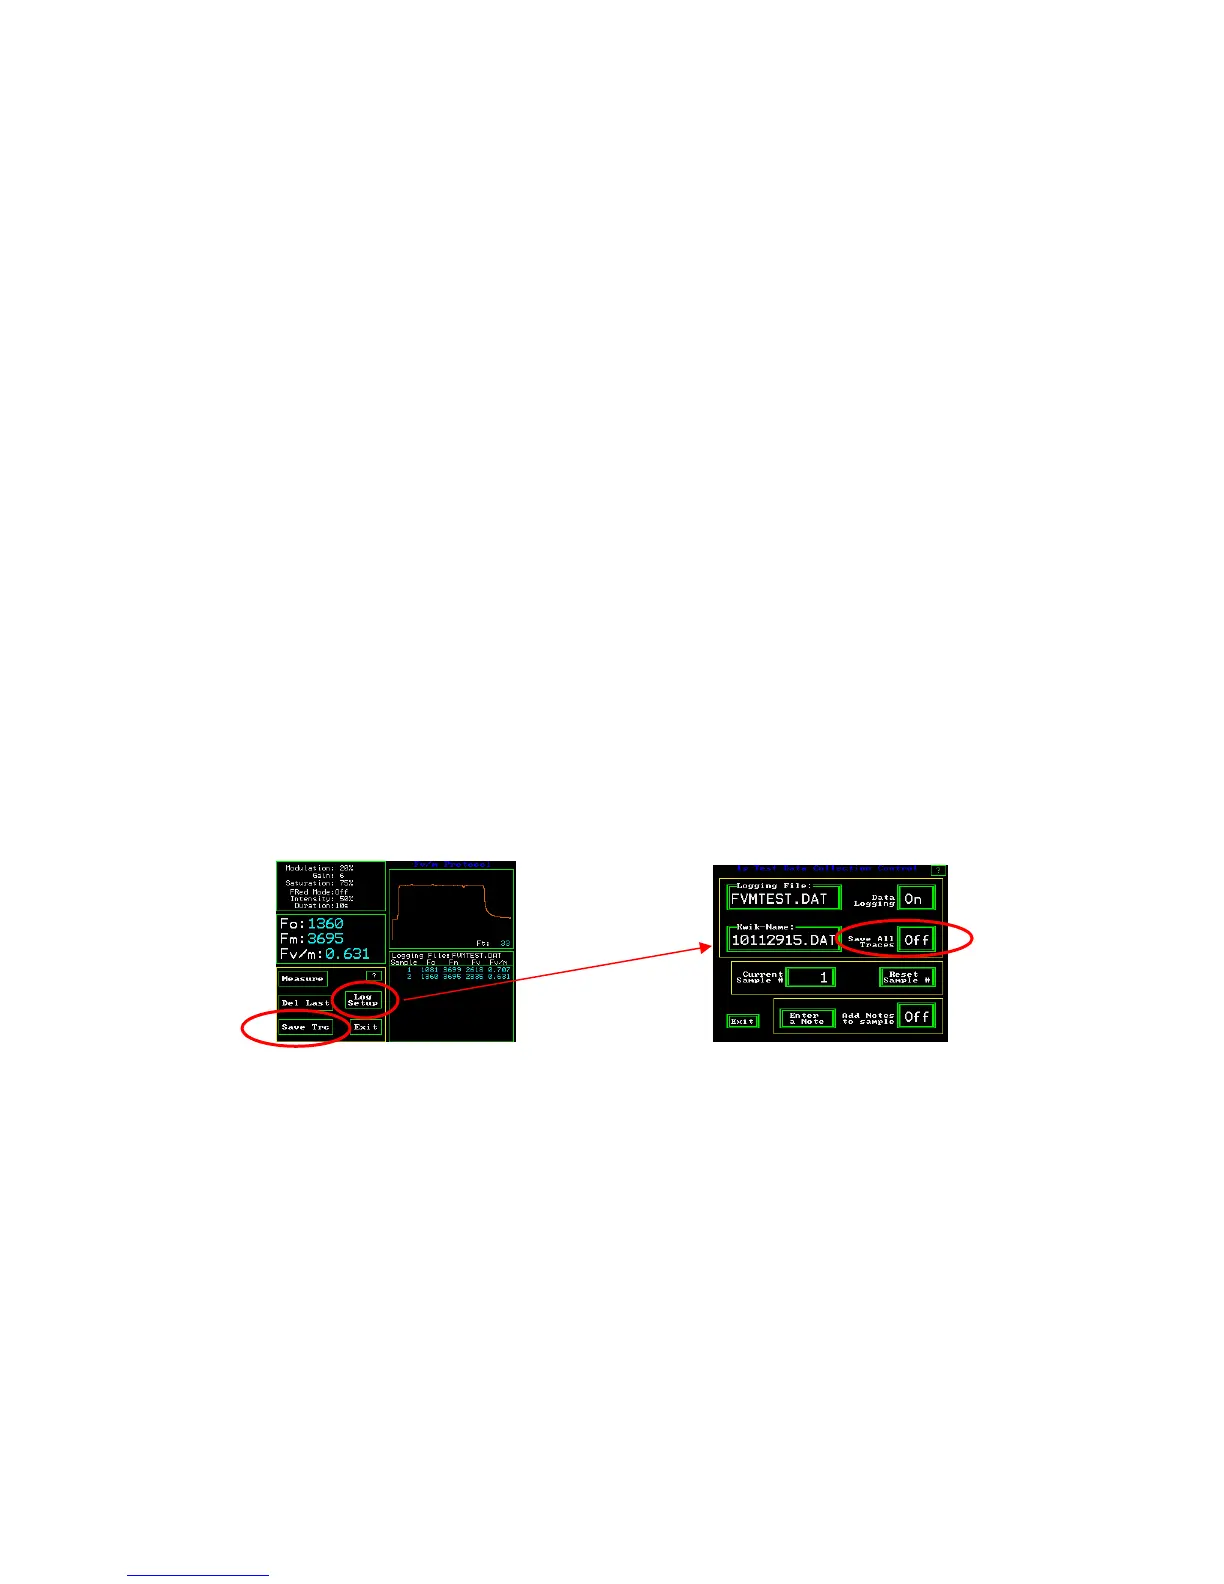
is a user set-able option. When joint saving of trace and data is desired, press the “Save Trc” trace button
on the measuring screen of each protocol that is being used. This will save the trace from the last
measurement. To save a trace with each measurement, press “Log Setup”. Next press “Save All Traces”
until the On value is displayed.
Fv/Fm measuring screen 1p Test Data Collection Control screen
This will give the file and trace the same identifying number. There can be almost an unlimited number of
different files and traces stored simultaneously in the system depending on memory use. The limiting
factor is usually the number of rows that Microsoft Excel software can support. Different versions have
different maximum values. Consult Microsoft for details on your software. Information on free memory
status is always available in the Diagnostics section, by looking at the screen for memory and software
version. See the Diagnostics section to see an image of this screen. Traces and tabulated data are always
saved together in quenching tests, There are specific formats for each type of data and trace. Each test
mode will generate a slightly different data output (each test measures different parameters). The details
of each type are listed at the end of this section.
All types of formats include a common header containing information about the date, time, machine
number, and setup of the machine when each measurement was made.