The TWAIN Interface 23
All rights are reserved.
When using the histogram, it is very helpful to preview the image. Changes made
to the histogram will instantly be shown on the image in
you to immediately judge the effects of the changes.
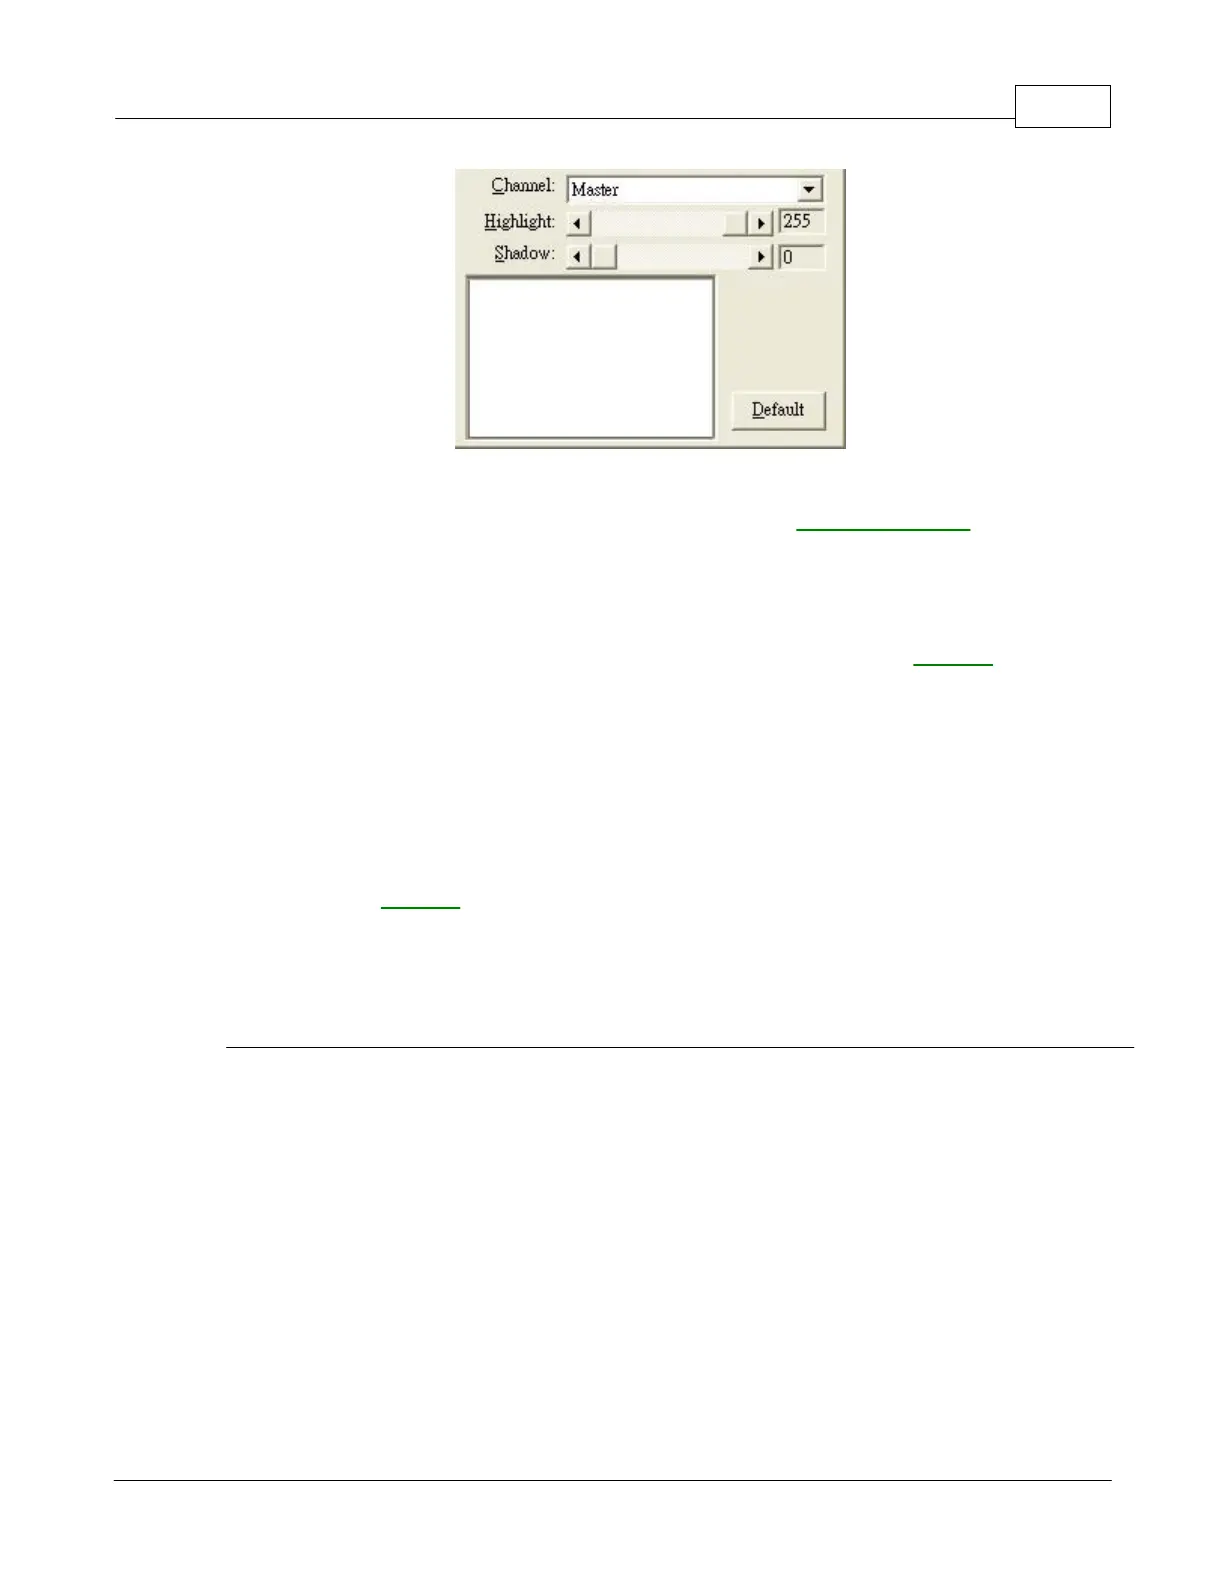
A histogram is a graphic representation of the tonal distribution (the brightness and
darkness levels) in an image. It plots the number of pixels (dots) at each
brightness level. The histogram displays these levels in 4 different
The x-axis of the histogram graph represents the color values from darkest (0) at
the far left to the brightest (255) at the far right; the y-axis represents the total
number of pixels at that value. A histogram for a dark image shows most of the
pixels at the left side of the graph. A histogram for a bright image is more heavily
weighted to the right side.
the scroll bar to the right or left
The current value is shown to right of the scroll bar.
The highlight represents the high (bright) end of the color spectrum. If the highlight
value of the Master channel is lowered to 245, all color values between 245 and