Roche Diagnostics
A-106
Operator’s Manual · Version 3.4
4Software Cedex Bio analyzer
Key screens
Apply filter criteria to the QC results list.
You can choose one of the following criteria:
o All
o Current Lot
o Previous Lot
f Workpla ce > QC History >
To view the information in the QC History chart better, results are displayed with
rounded value (qualitative display).
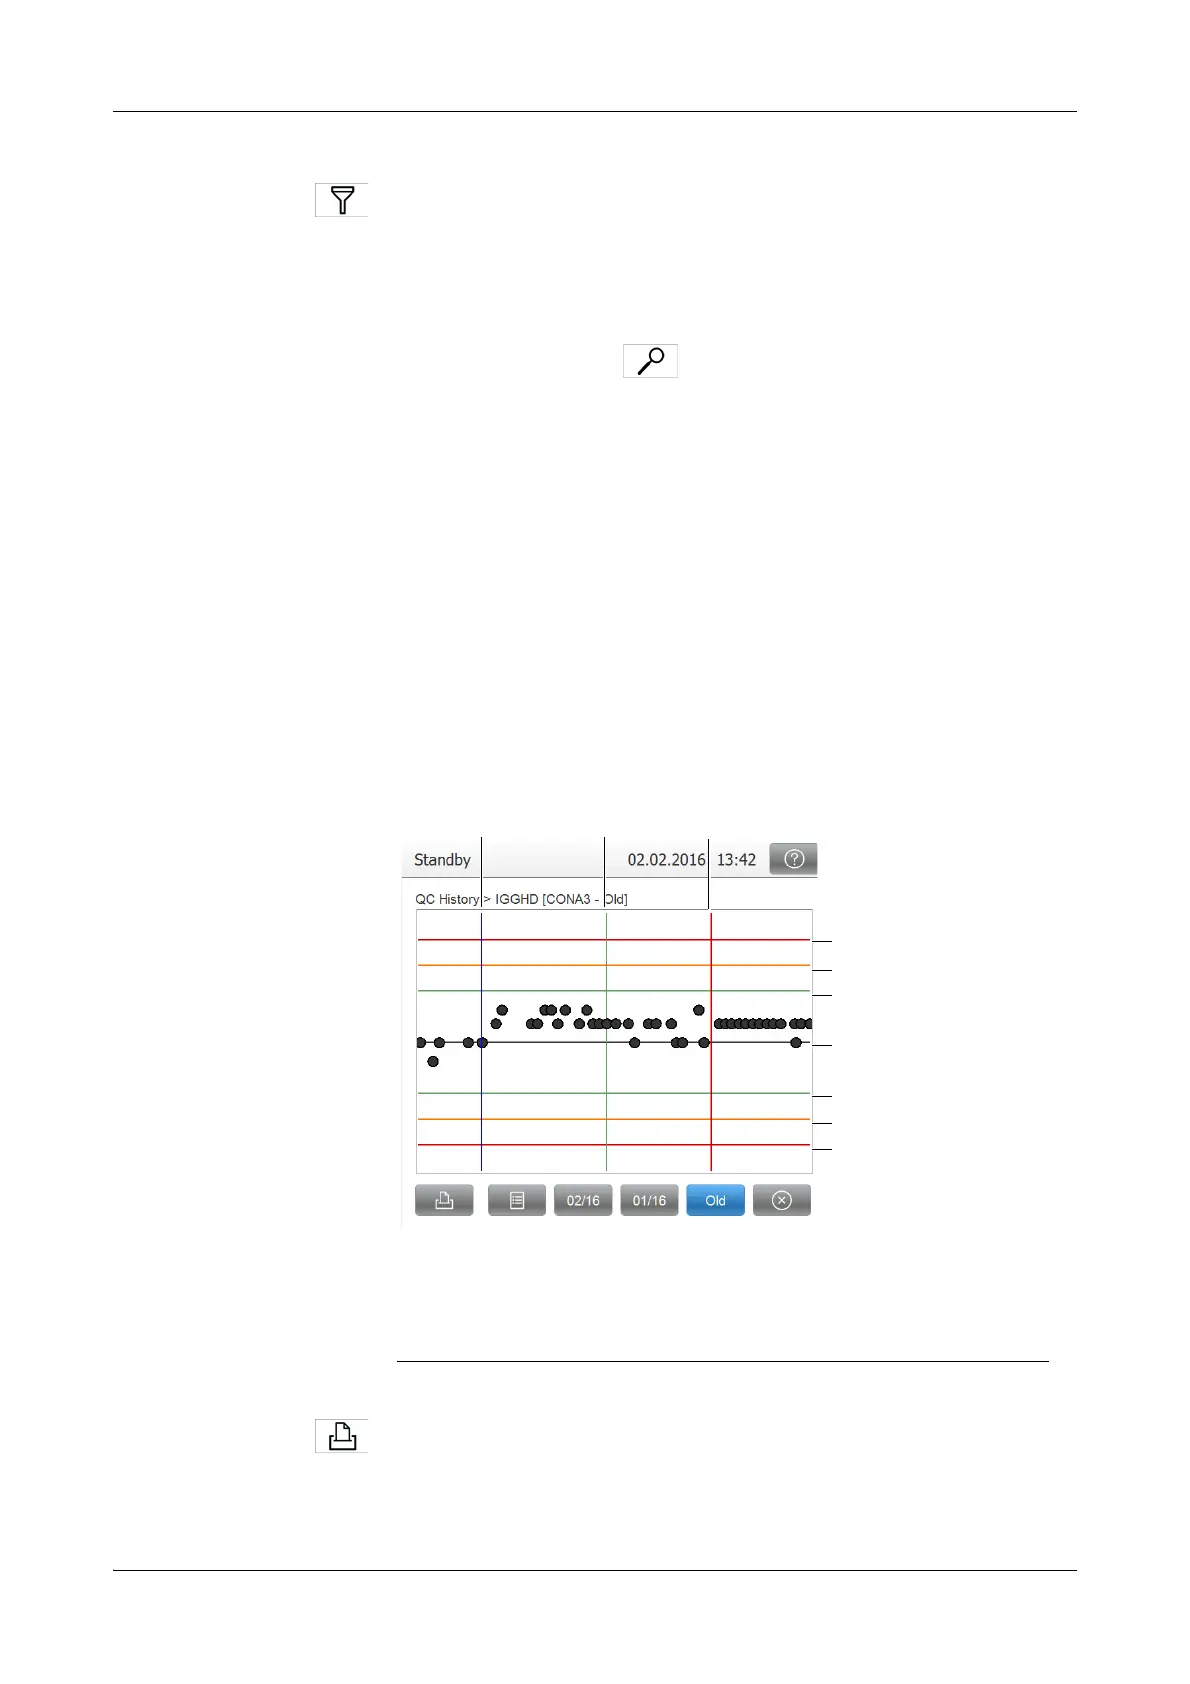
Results are shown in the QC History chart as follows:
o ≤0.5s: Result is placed on the middle line.
o ≤1.0s: Result is placed below the invisible 1s line.
o ≤1.5s: Result is placed above the invisible 1s line.
o ≤2.0s: Result is placed below the 2s line.
o ≤2.25s: Result is placed above the 2 line.
o ≤2.5s: Result is placed below the 2.5s line.
o ≤2.75s: Result is placed above the 2.5s line.
o ≤3s: Result is placed below the 3s line.
o >3s: Result is placed above the 3s line.
Exact values can be read at any time in the list page.
Print the graphic.
A Calibrator lot change
B Reagent set change
C QC target value change
D +3s
E +2.5s
F +2s
G Mean value
H -2s
I -2.5s
J -3s
Figure A-66 QC history graphic