Roche Diagnostics
Operator’s Manual · Version 3.4 C-15
Cedex Bio analyzer 8 Data analysis methods
Photometric measurements
Carrying out the antigen excess
check
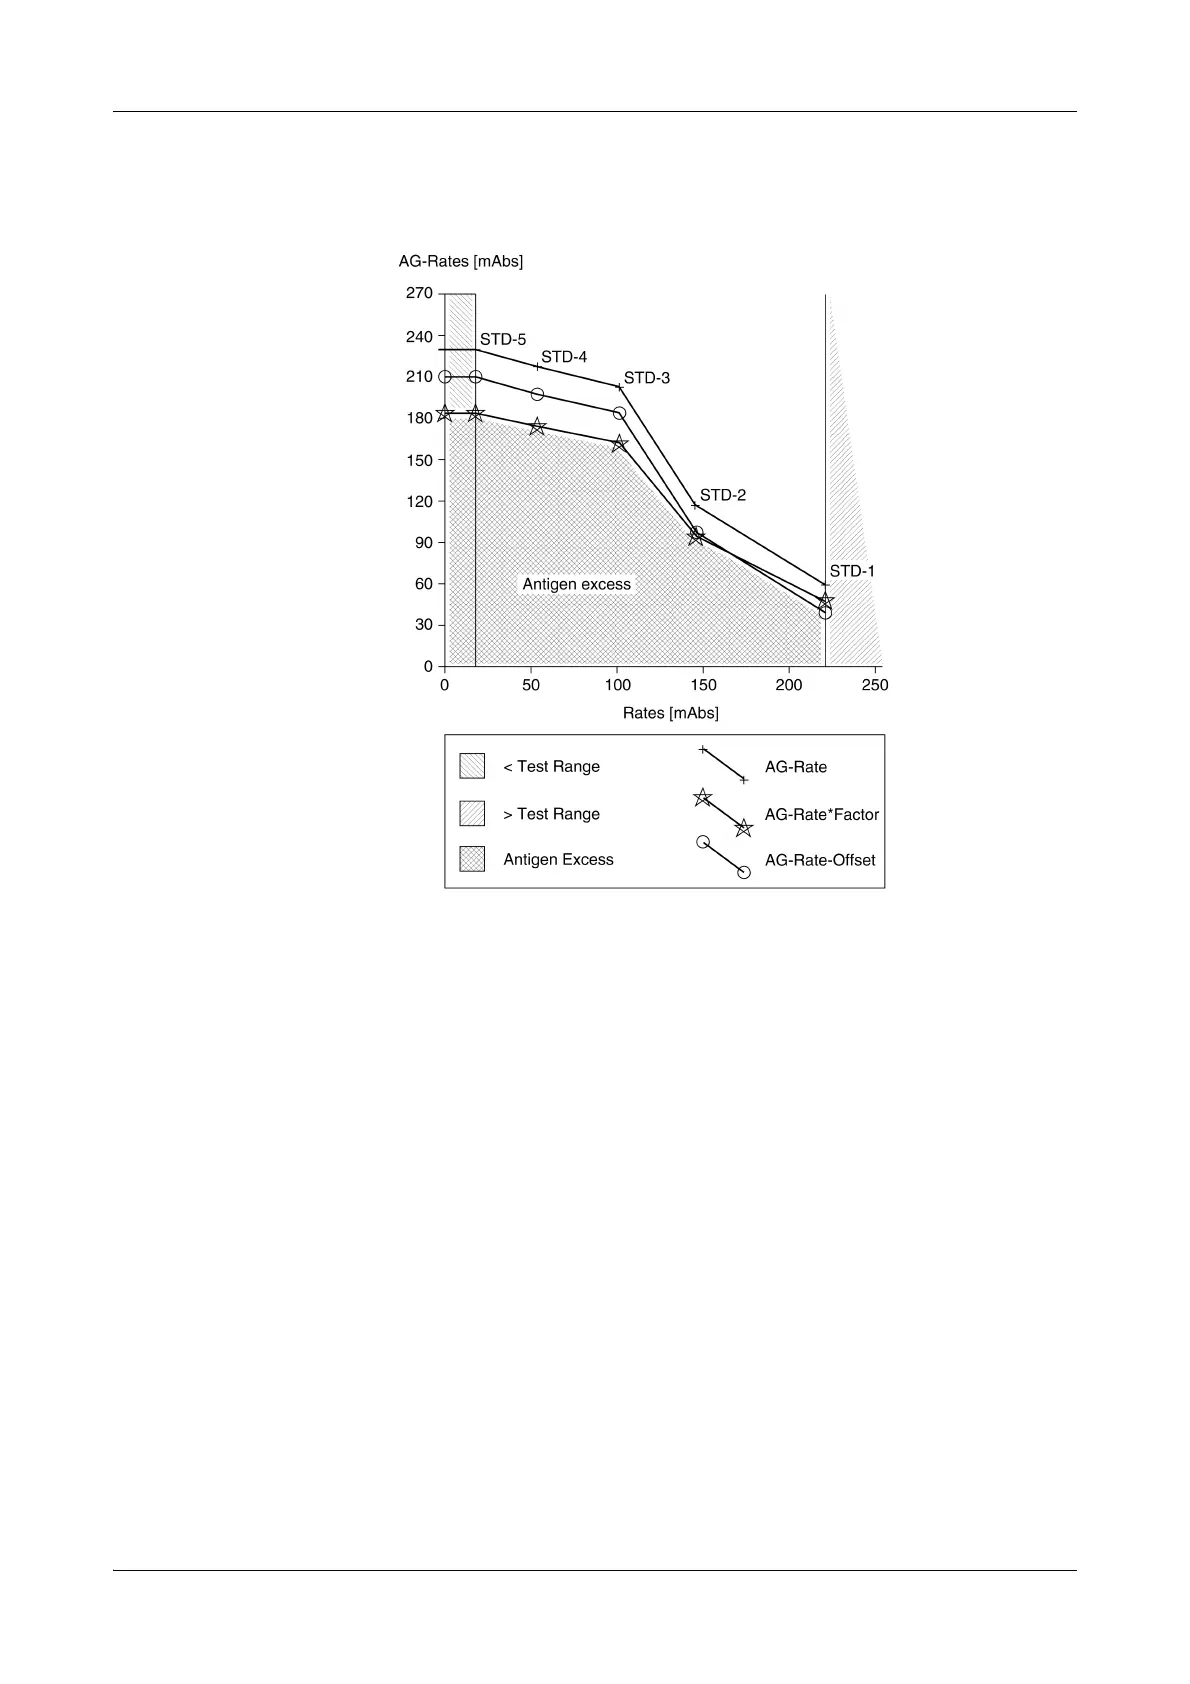
The following figure shows a Rate/AG-Rate curve for the standards. The graph was
created using linear interpolation.
The rates of the samples are determined using the corresponding antigen rates of the
standards from the Rate/AG-Rate curve.
For rates outside the range between STD-5 and STD-1, the following applies:
o If they are below the lowest standard the antigen rate is assigned to the lowest
standard.
o If they are above the highest standard the antigen excess check is not carried out.
and
The AG Excess flag is displayed if the checks are not fulfilled.
Antigen rate of the standard.
Test-spec ific fac tor.
Antigen rate of a sample.
Defined rate (for Cedex Bio analyzer approximately 0.004 Abs.).
A
cuv
AR
std
F
AG
%[]⋅
100 %[]
--------------------------------------
≥