37
4. Basic Operations
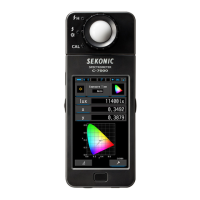
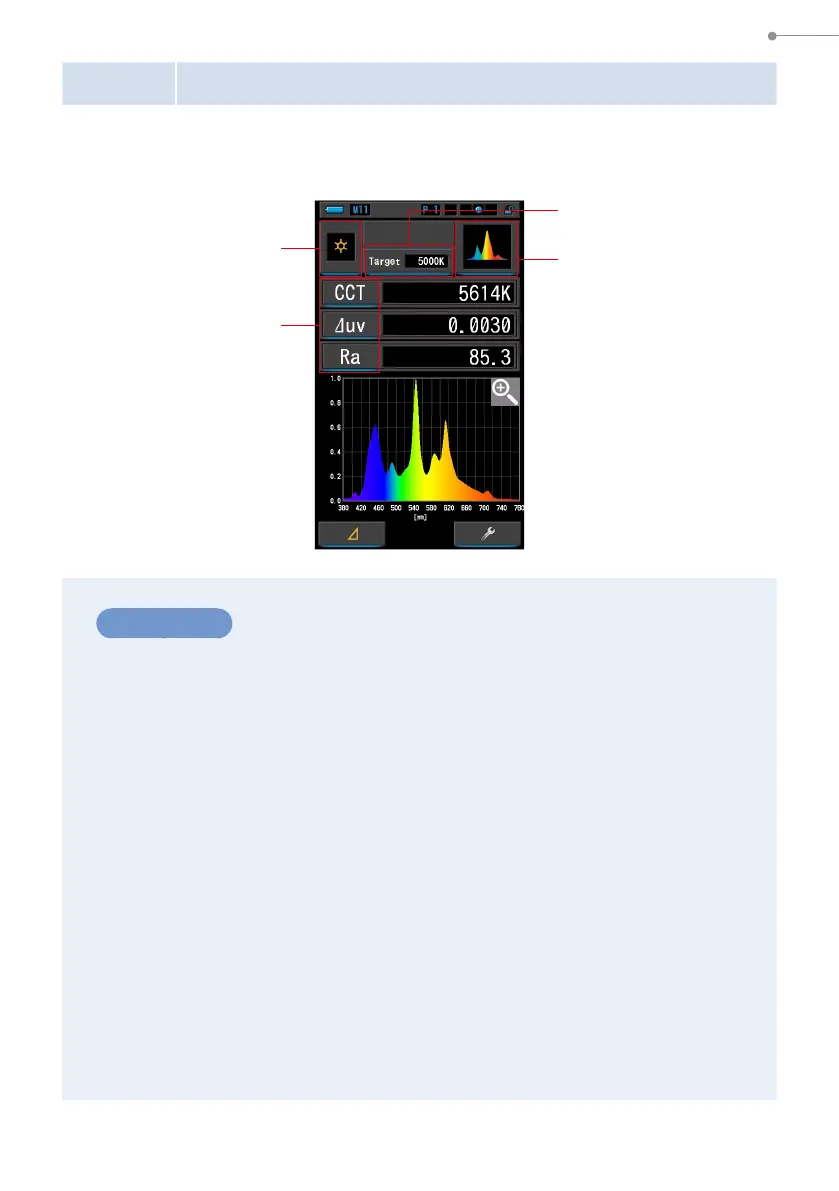
4-4-2 Displaying in Spectrum Graph [Spectrum] Mode
Displays three user-selected values and spectral distribution graph.
Operation
1.
Touch the [Spectrum] icon on the Display Mode Selection screen.
A spectrum distribution graph screen will be displayed. (
P30)
2.
Touch the [Measuring Mode] icon.
The Measuring Mode Selection screen will be displayed. Select the desired
measuring mode to use. (
P22)
3.
Touch the [Target] indication.
Target CCT Input screen will be displayed. (
P26)
Set the desired color temperature number.
4.
Touch the [Display Item] indication to change.
The Display Item Library screen will be displayed. (
P35)
Touch the desired Display Item and [OK] button.
[Target] Indication
[Measuring Mode] Icon
[Display Item] Indication
[Display Mode] Icon
Spectrum Mode
Spectrum Screen
 Loading...