Enable the
Show additional measurements
checkbox to view additional measurements that are done
but which are ignored when determining the alarm status. These will appear with a ‘half-bulb’ icon
indicating that the check is disabled whilst also showing the status of this element. As an example this
can be used to view the BAT section repetition interval and section gap, or to view a list of PIDs with CC
errors including the PIDs for which this check has been manually disabled.
Click a PID in a PID list to view PID details. Similarly you can click on a service to view service details.
If the Clear status button is clicked the error counts are reset and the ETR 290 analysis restarts.
The details of the individual ETR 290 measurements are described in a separate document called
Sencore VideoBRIDGE ETR 290 Details — Extended ETSI TR 101 290 Testing.
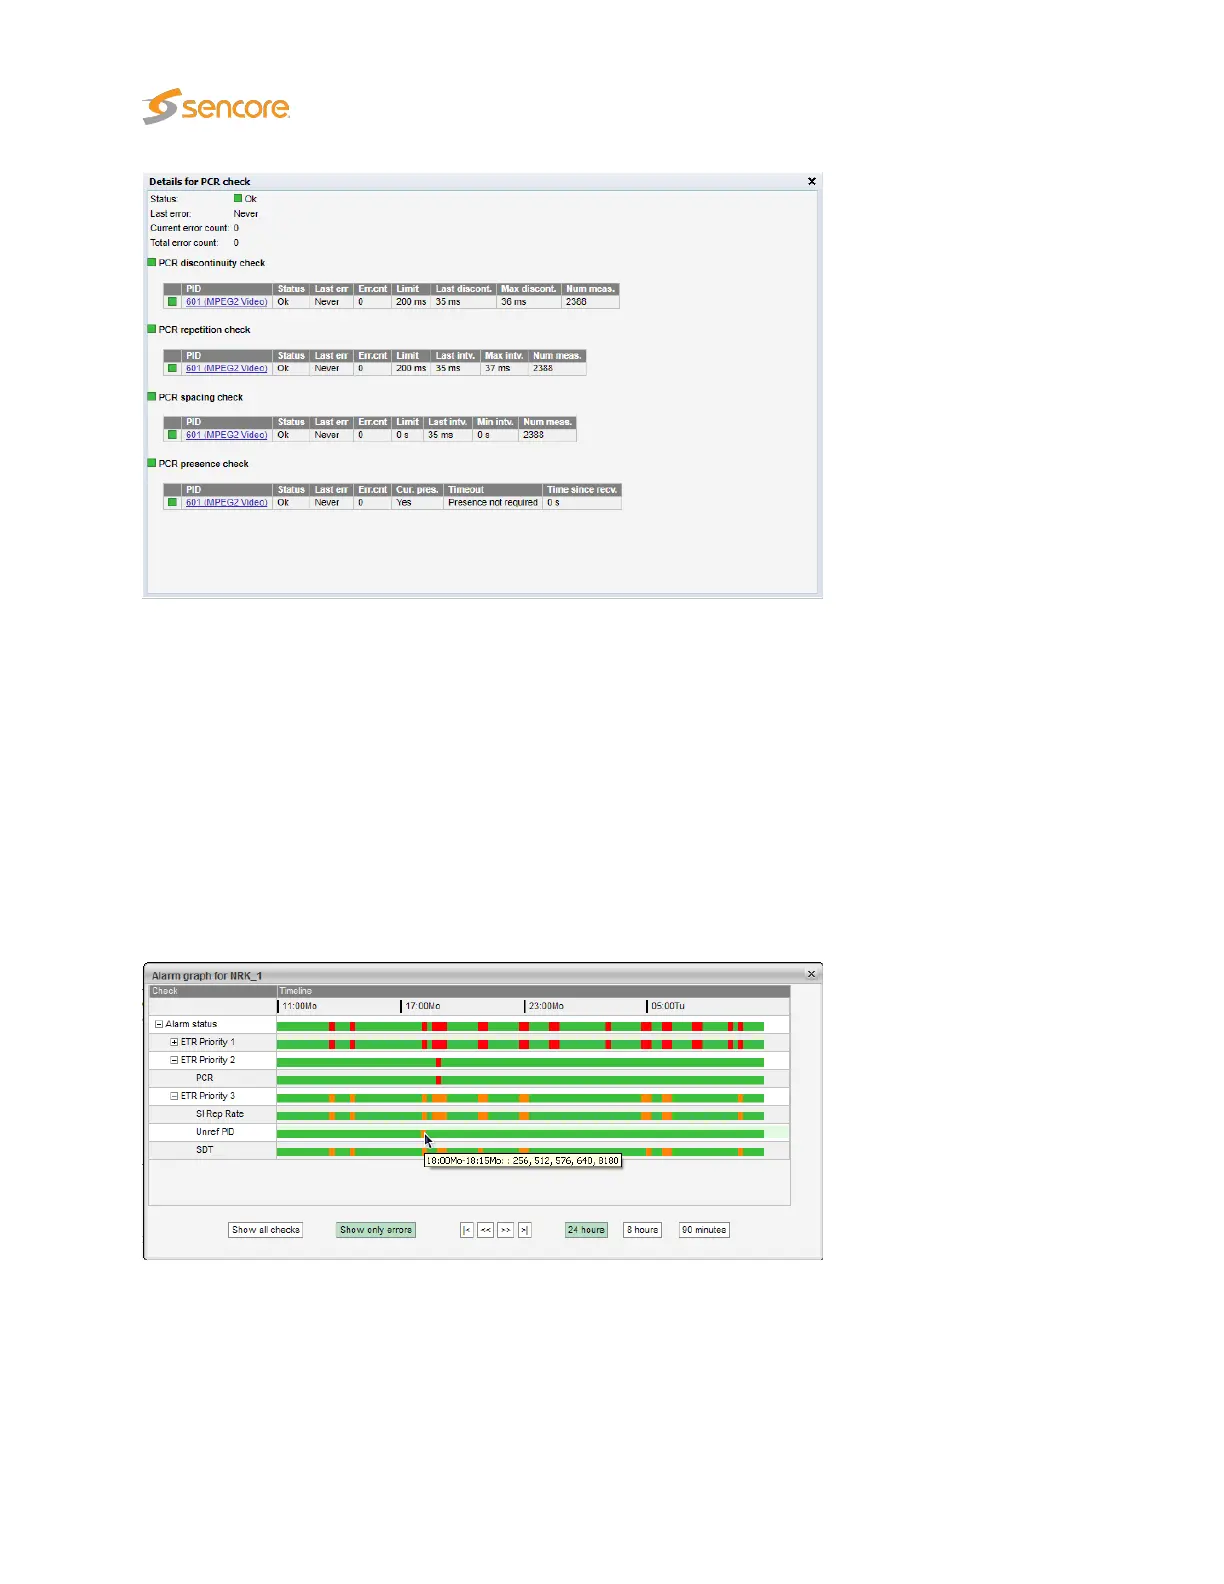
Clicking the Show alarm graph button opens the Alarm graph pop-up view.
The alarm graph shows the transport stream ETR alarm status over time in the form of a status timeline.
The timeline bar shows the stream status for a time span of 90 minutes, 8 hours or 24 hours as selected
by clicking the time selection buttons below the timelines. The stream bar reveals any alarm that has been
present during the selected time period. The bar color is either green for OK or colored in accordance
with the alarm severity if an alarm has occurred. Refer to section 6.2.2 for a description of the alarm
128 VB2xx GigE User’s Manual version 5.4