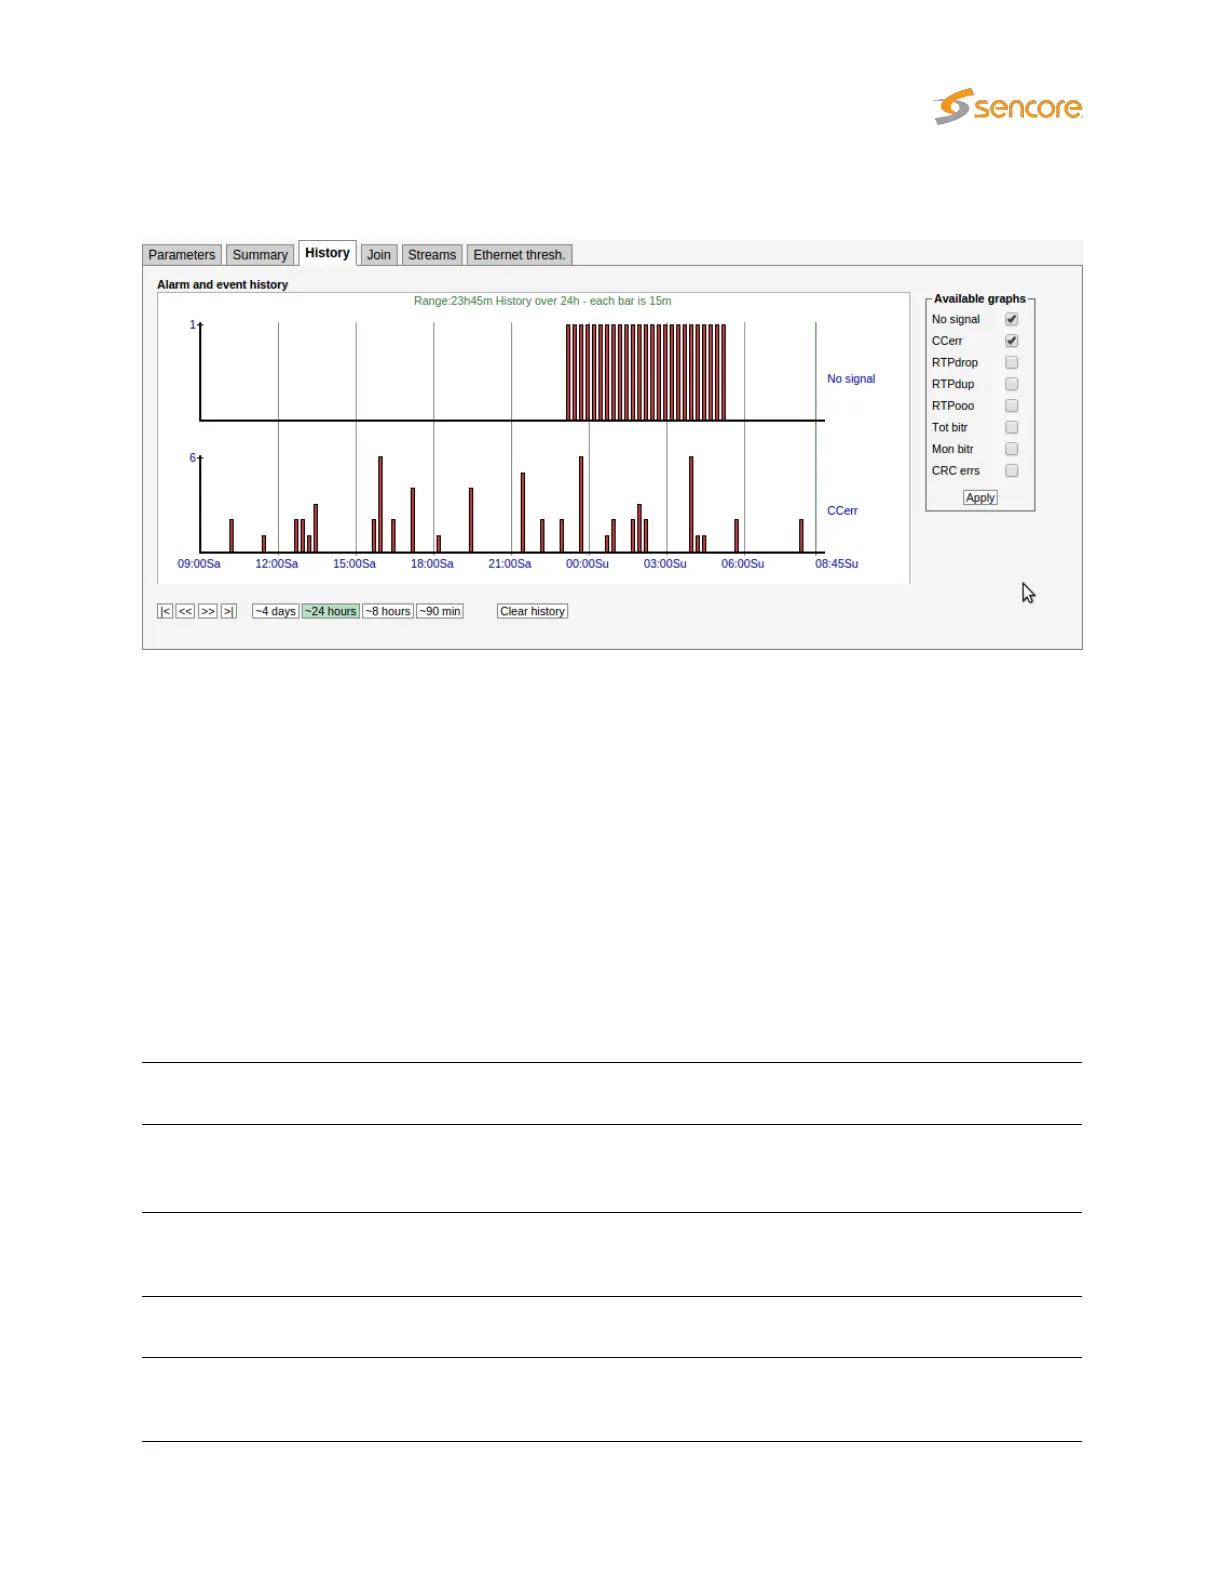
6.4.4 Multicasts — History
The probe keeps statistical Ethernet information for the last 4 days for visual inspection in the
history
timeline view.
Each bar in the histogram corresponds to a number of events that occurred within a certain time interval.
The interval that each bar represents depends on the scale, from 1 minute (when 90 min is selected) to 1
hour (when 4 days is selected).
Clicking the Clear history button will reset all history graphs.
Tool-tip information is available for each bar and shows the time-interval for the bar and its exact value.
For example, the tool-tip information ‘1315-1330:2’ means that within the time interval 13:15–13:30 there
were 2 occurrences.
The histogram is updated every minute.
Any subset of the following parameters can be selected, click the
Apply
button for changes to take effect:
No signal:
The number of streams that reported the ‘No signal’ alarm during the interval represented
by the bar.
CCerr:
The number of times a discontinuity has been detected for all the MPEG-2 Transport
Stream continuity counters in the interval represented by the bar. This parameter
corresponds to the sum of CC errs reported by all streams.
RTPdrop:
Accumulated number of dropped IP-frames due to network errors in the interval repre-
sented by the bar. This parameter corresponds to the sum of
RTP drops
reported by all
streams.
RTPdup:
Accumulated number of duplicate IP-frames in the interval represented by the bar. This
parameter corresponds to the sum of RTP dups reported by all streams.
RTPooo:
Accumulated number of times a packet has been found to be out of order in the interval
represented by the bar. This parameter corresponds to the sum of
RTP ooo
reported by
all streams.
VB2xx GigE User’s Manual version 5.4 93