clicked. Note that locking the ETR 290 processing to one stream will affect alarm handling and all ETR
290 views. Active alarms for streams that are not currently being analyzed will freeze (remain active) until
the processing lock is deselected and ETR 290 analysis eventually shows that the error state is cleared.
The user can select one input to be displayed exclusively by clicking the corresponding
Show only this
input button. This does not affect ETR 290 processing or alarming.
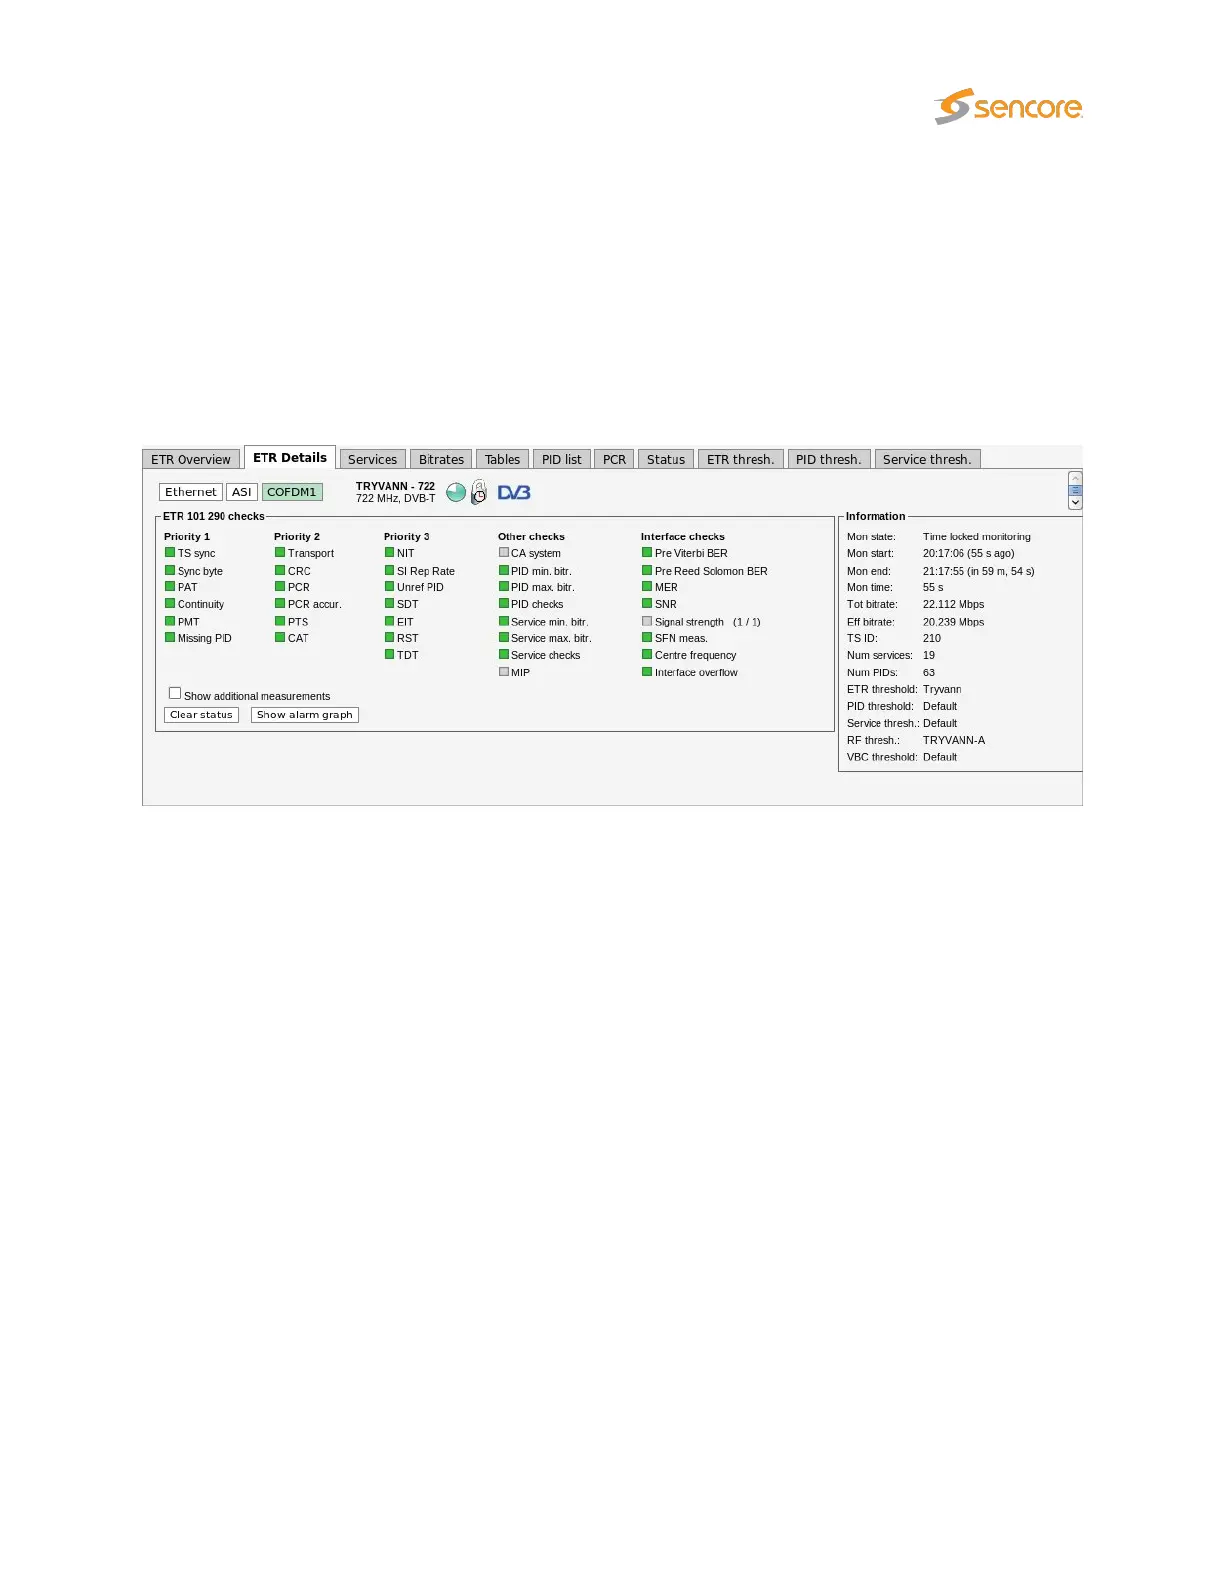
6.9.2 ETR 290 — ETR Details
The ETR Details view shows the ETR 290 status for the current stream of the user-selected input. The
name of the current stream is displayed in addition to the two round-robin indicator icons when relevant:
the time cycle icon and the lock icon. By clicking the lock icon the round-robin tuning process is stopped
(locked to the current frequency) or resumed. A DVB or ATSC icon indicates the analysis mode. The
analysis mode is defined as part of the ETR threshold template.
The ETR 290 parameters are grouped into five different categories. The first three groups are defined in
the ETSI TR 101 290 guidelines. The fourth category contains checks defined by Sencore allowing CA
system checks, custom PID and service checks, content checks (checking the video for freeze-frames
etc) and the Gold TS reference checks. The last category contains checks of the input interfaces such as
RF measurements for demodulators.
For each check a bulb indicates the current status of that parameter check: green indicates status OK
whereas red indicates an active alarm. When the probe has not yet received data relevant for a particular
check, the corresponding bulb is white. Grey color indicates that the check has been deactivated (as set
in ETR 290 — ETR thr. — Edit).
When clicking one of the ETR 290 parameters, details about the current status can be viewed for that
item.
VB2xx GigE User’s Manual version 5.4 127