color representation. Periods of time when the stream has not been ETR monitored due to round-robin
operation are represented by grey. By using the arrow buttons it is possible to view alarm occurrences up
to 24 hours back in time even if the highest graph time resolution is selected.
If alarms have occurred during the selected time period, the status timeline will not be all green. In this
case it is possible to expand the timeline tree by clicking the plus sign at the timeline. Individual timelines
for different ETR priorities and for different alarms may be viewed as the tree is expanded into several
levels. Tooltips reveals details about an error incident.
By default the ‘Show only errors’ mode is selected, and only timelines that are not all green will be
displayed. By clicking the
Show all checks
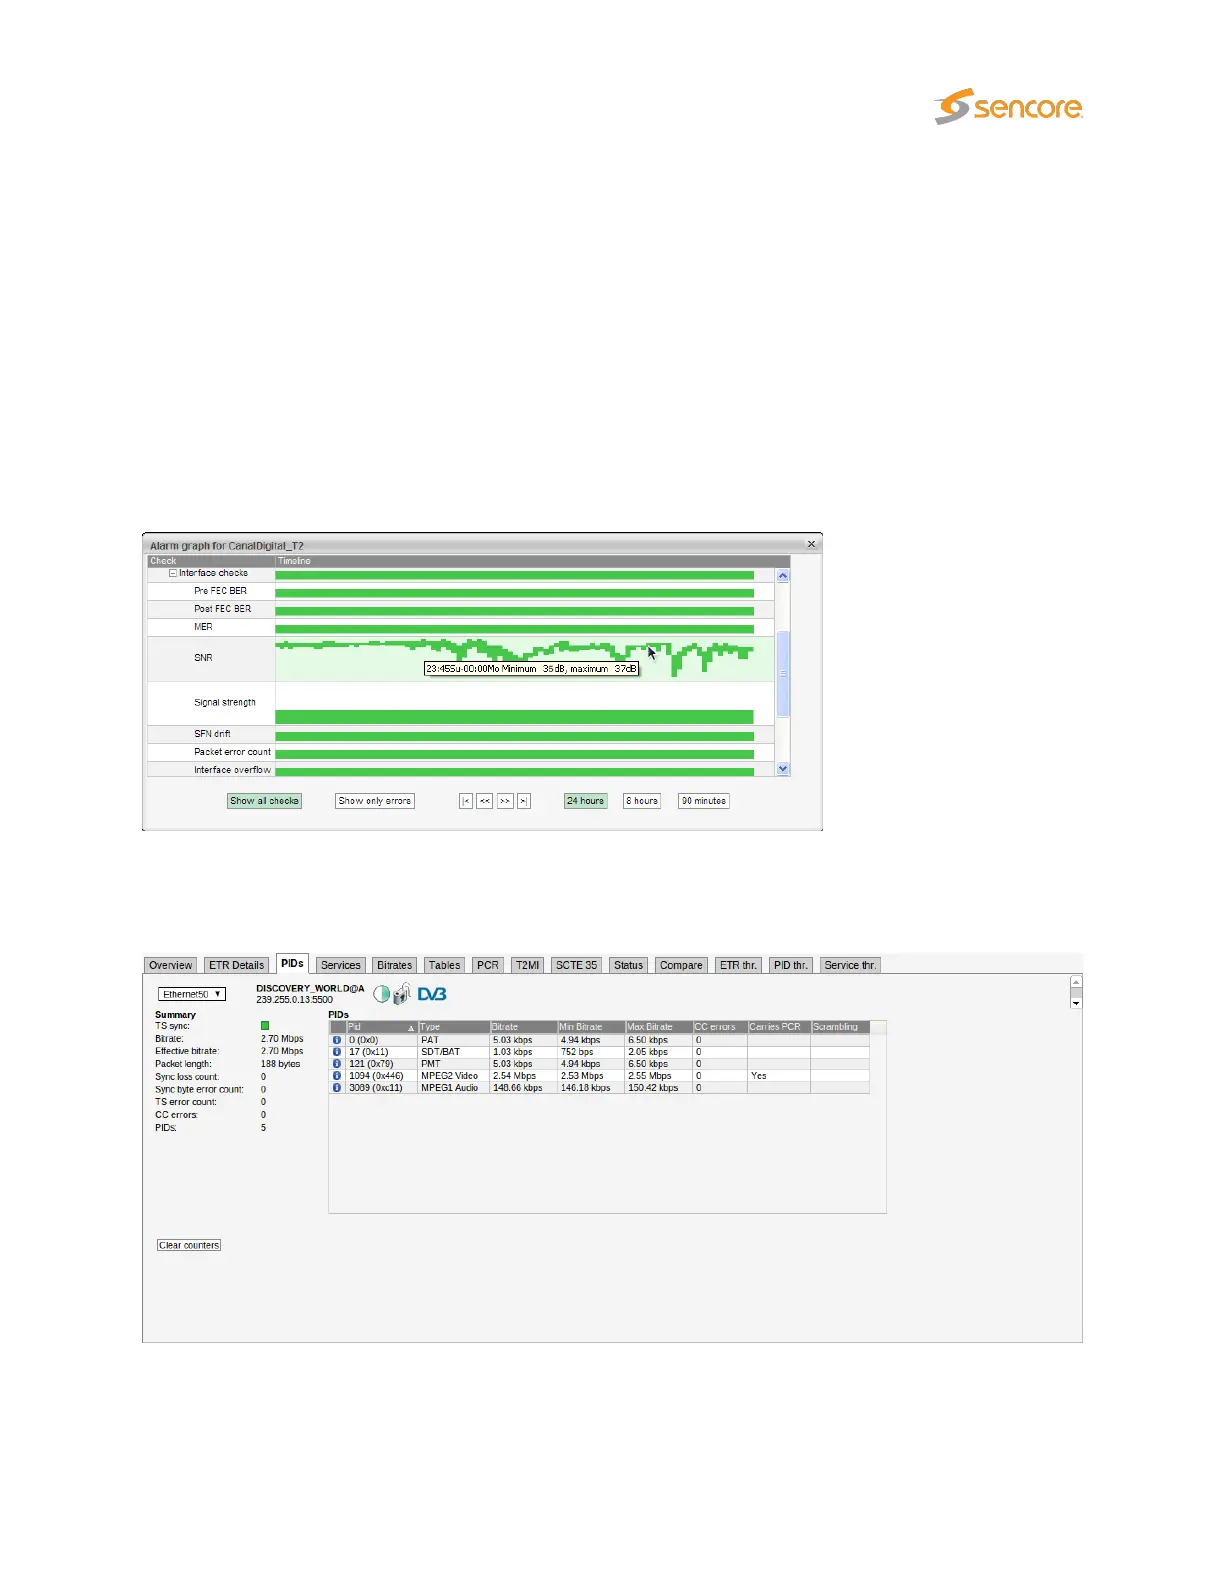
button it is possible to access demodulator measurement
graphs, if relevant. Note that graphs representing MER, SNR and Signal strength are always present,
irrespective of probe hardware configuration. These graphs show the maximum and minimum values of
the parameter during the period.
6.9.3 ETR 290 — PIDs
This view lists the PIDs of the currently active stream of the selected input. The PID list can be sorted by
clicking a table column header.
VB2xx GigE User’s Manual version 5.4 129