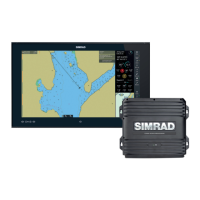
Display palettes
4 display palettes are available for optimum color contrast under different light conditions.
The Red and Black palette is not included in the ECDIS standard. When this palette is
selected, this will be indicated with a yellow indicator on the Palette button.
The display brightness is set by using the Palette button:
• Right-click to display and select palette options
• Left-click to return to ECDIS approved palette
Warning: Details in the chart may be less visible when one of the dark
palettes is selected. To increase the chart readability for the dark palettes,
select the 2 colors option in Portrayal settings. Refer "Portrayal settings" on page
25
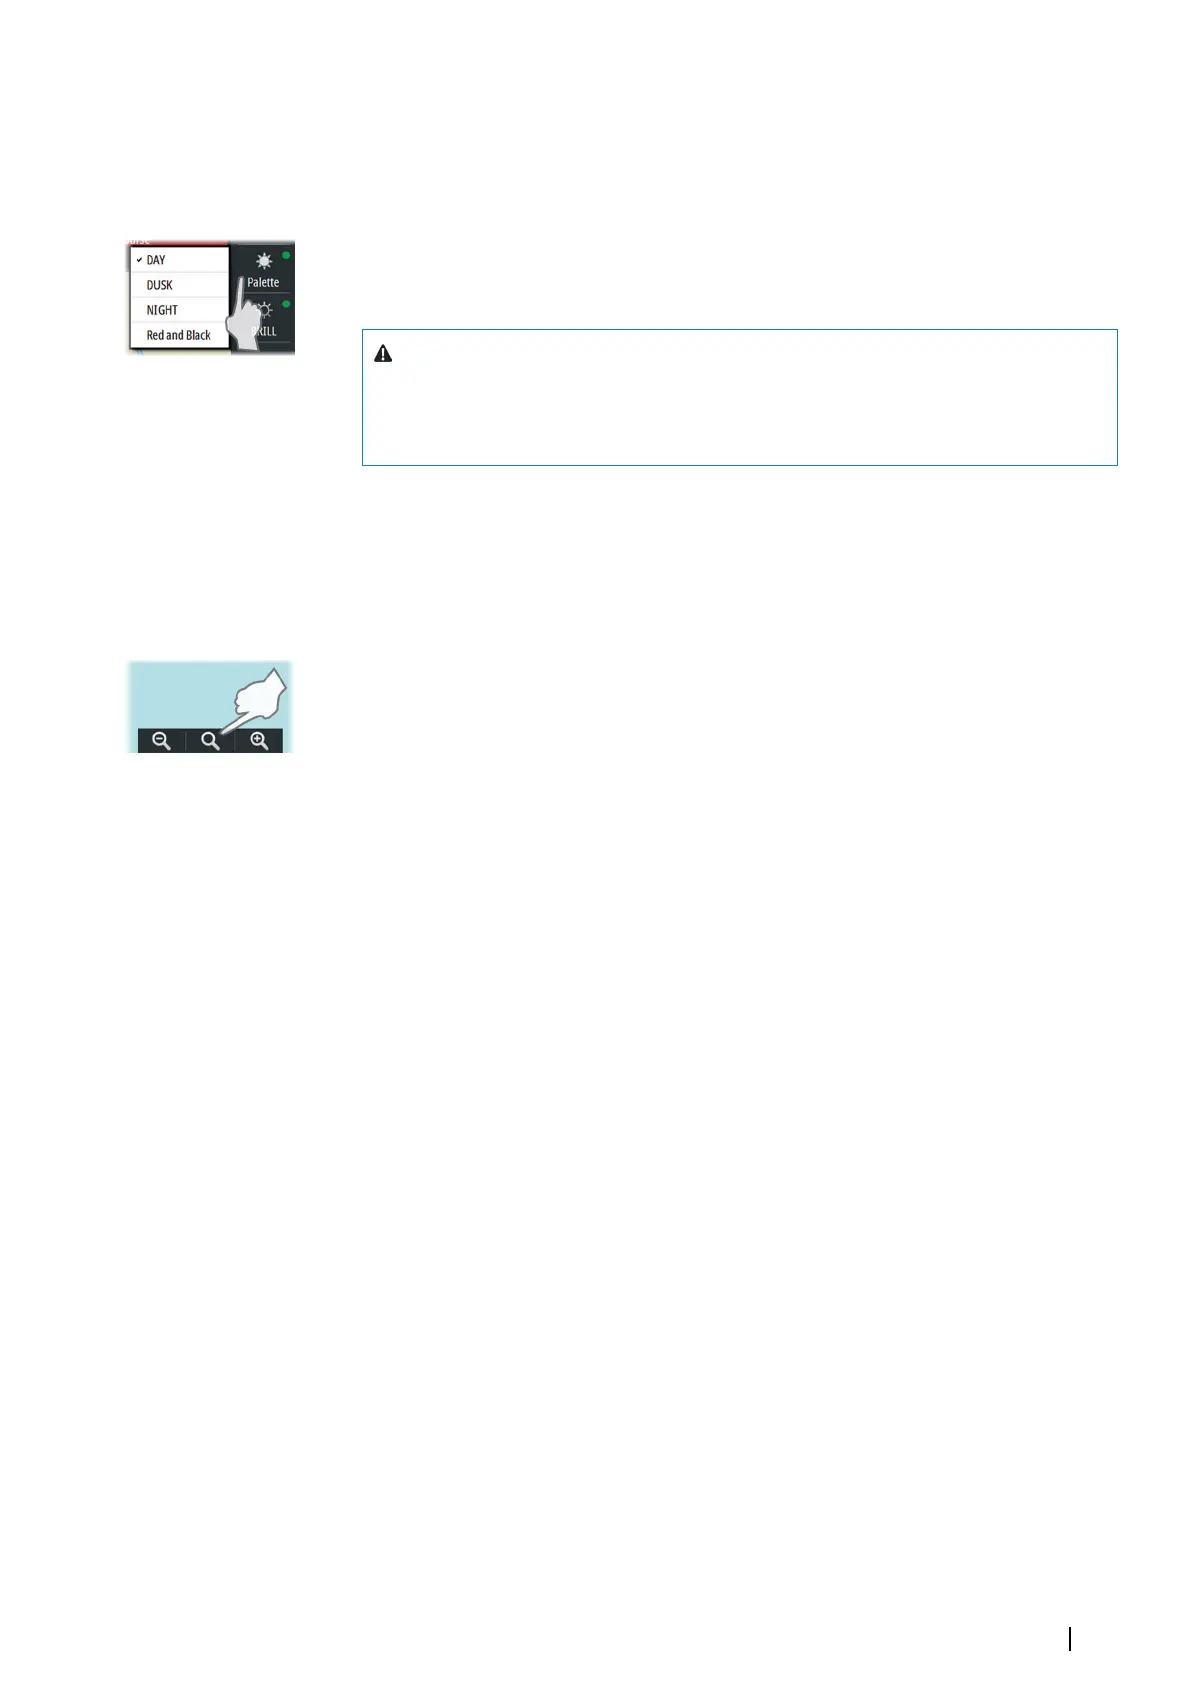
Selecting the chart scale
Current chart scale is shown in the Chart Info panel.
The chart scale is changed by:
• scrolling up/down with the scrollwheel
• using the zoom buttons on the chart panel
Select the middle zoom button for selecting the best scale available for the vessel's position.
For more details see "Keep best scale" on page 28.
Moving the chart center
You move the chart by:
• Panning (moving the cursor while holding down the left cursor key)
• Left click to center the chart on the current cursor position
• Left clicking the Cursor read-out panel and then entering the selected position for the
chart center
You can also move the chart to a route or to a selected chart. See more information in
"Displaying a route" on page 48 and "Chart catalogs" on page 56.
Basic operation | E50xx ECDIS Operator Manual
19