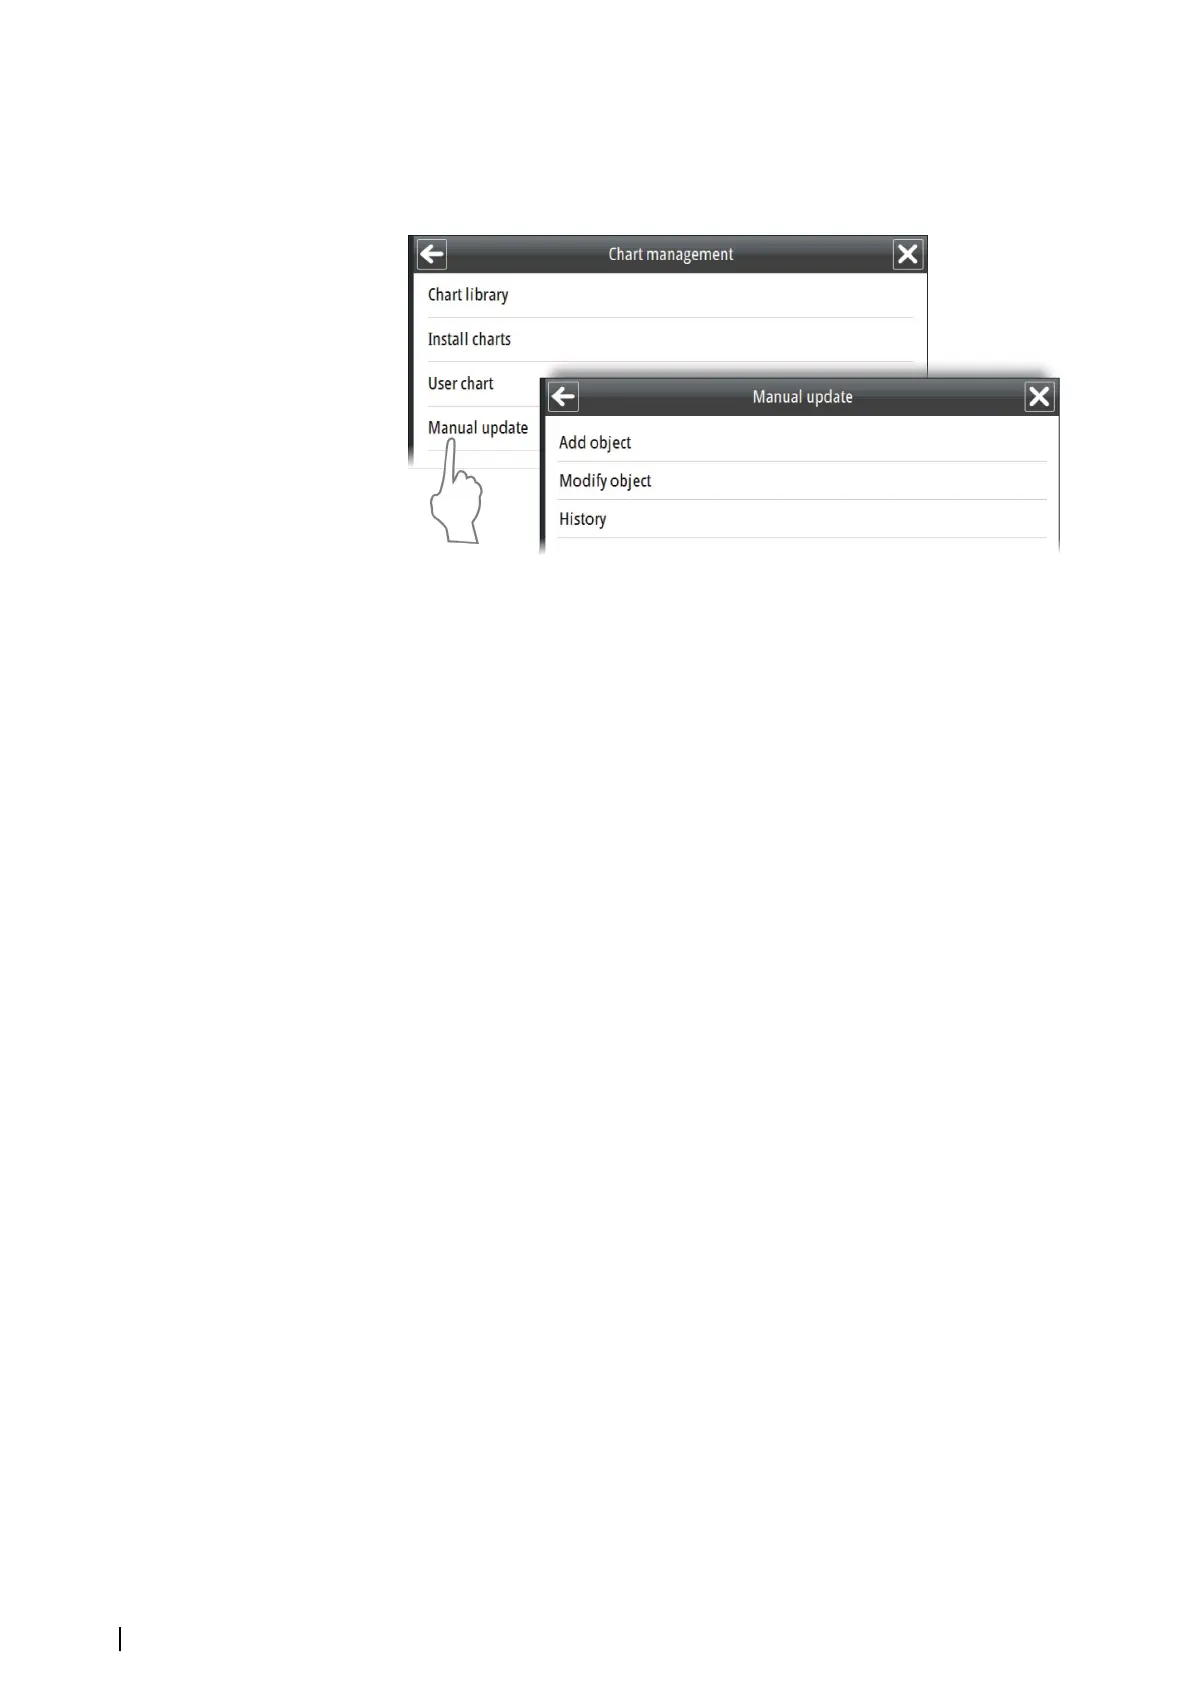
Manual chart updates
You can manually edit a dataset by adding new objects and modify existing objects by using
the Manual update function.
Ú
Note: The Manual update option is only to be used for official chart updates. Other chart
information can be added to the chart by using the User chart function. Refer to "User
chart objects" on page 58.
Adding a Manual update
1. Move the chart to show the area where you want to position the new object
2. Right-click on the chart and select Chart info to display the name of the chart cell where
you want to add the new object
3. Select the Add object in the Manual update menu
-
A list of chart cells available for the current chart view is displayed. This list includes all
chart cells for the shown area, also those not displayed
4. Select the chart cell to which you want to add the new object
- The chart view is moved and scaled to show the selected chart cell and the coverage
for this
- A list of object categories is displayed in the menu area
5. Select a category and then the type of object you want to add
- The selected object type is displayed in the menu area
6. Select the geometry icon to display option for shape and position
7. Position the object by either entering the coordinates manually or by positioning the
cursor in the chart
8. Continue entering new positions if the object shape is an area or a line
9. Select the Apply button to confirm the object shape and position
10. Edit details for the object if required by using the Settings icon, eventually add child
objects by using the Child icon
11. Select the Save button to save the object
The object is now saved to the selected chart cell.
Ú
Note: When selecting a chart cell, the chart view is moved and scaled to display the
selected chart cell and it's coverage. It is not allowed to plot or edit an object outside the
selected chart cell.
User chart objects
You can plot your own markers or areas to identify events, hazards, mariner objects, etc. in
the chart. User chart objects are not saved to a specific chart dataset, but to a separate layer
that can be turned on and off.
58
Managing the chart database | E50xx ECDIS Operator Manual