Ú
Note: The Keep best scale option is turned off when you manually zoom the chart. You
can temporarily display the best scale available by pressing the best scale zoom button,
but this does not turn on the Keep best scale option.
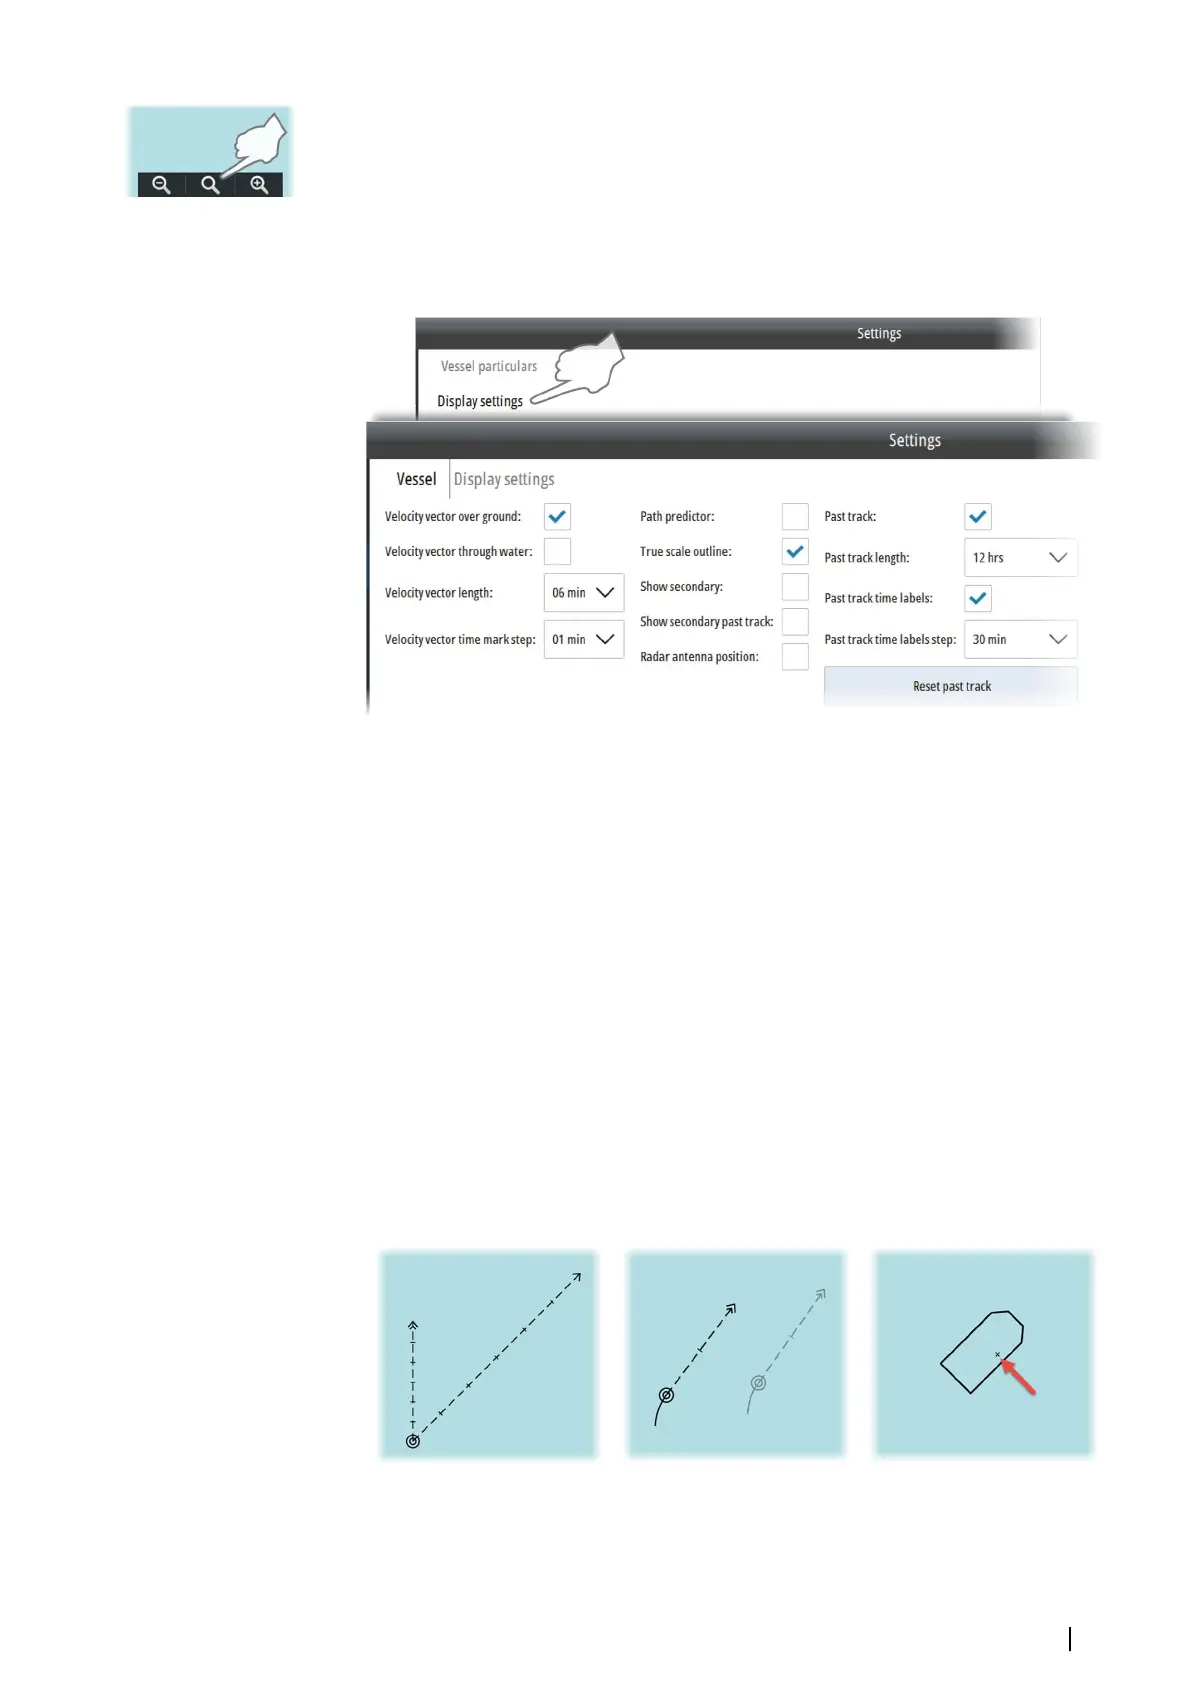
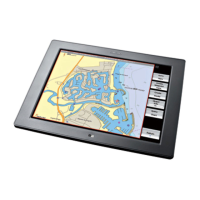
Own vessel's display settings
You select how your own vessel is displayed on the chart panel from the Vessel Display
settings dialog.
The following options are available:
• Velocity vector settings: Velocity vector of the vessel is a vector predicting position of
the vessel in a specified period of time based on the current speed and course. Two
velocity vectors are available: Velocity vector over ground based on speed over ground
and course over ground, and Velocity vector through water based on speed through
water and heading. You select the vector length in minutes and the time between the
marks on the vector
• Path predictor: Along with the velocity vectors you can display a path prediction vector.
Path predictor is based on speed over ground, course over ground and rate of turn
• True scale outline: Displays the vessel with a true scale symbol at large chart scale. The
symbol size is based on the vessel characteristics settings
• Show secondary/Show secondary past track: Displays the vessel's past position and
past tracks read from the secondary sensors. Data from the sensor in use is drawn with
black lines. If there is valid data from sensors not in use, these appear as greyed
• Radar antenna position: Indicates the radar antenna position on own vessel outline or
symbol
• Past track settings: Displays the vessel's past tracks on the chart. You select the track
length in minutes and the time between the marks on the track. The past track length,
time marks, mark steps and reset option affect tracks for both primary and secondary
sensors.
Velocity vectors
Primary and secondary sensors True scale outline with radar antenna
position
Setting up the chart panel | E50xx ECDIS Operator Manual
29