13 Visualization of the energy management
SMA Solar Technology AG
Operating manual 89HM-20-BE-en-19
13.2 System overview
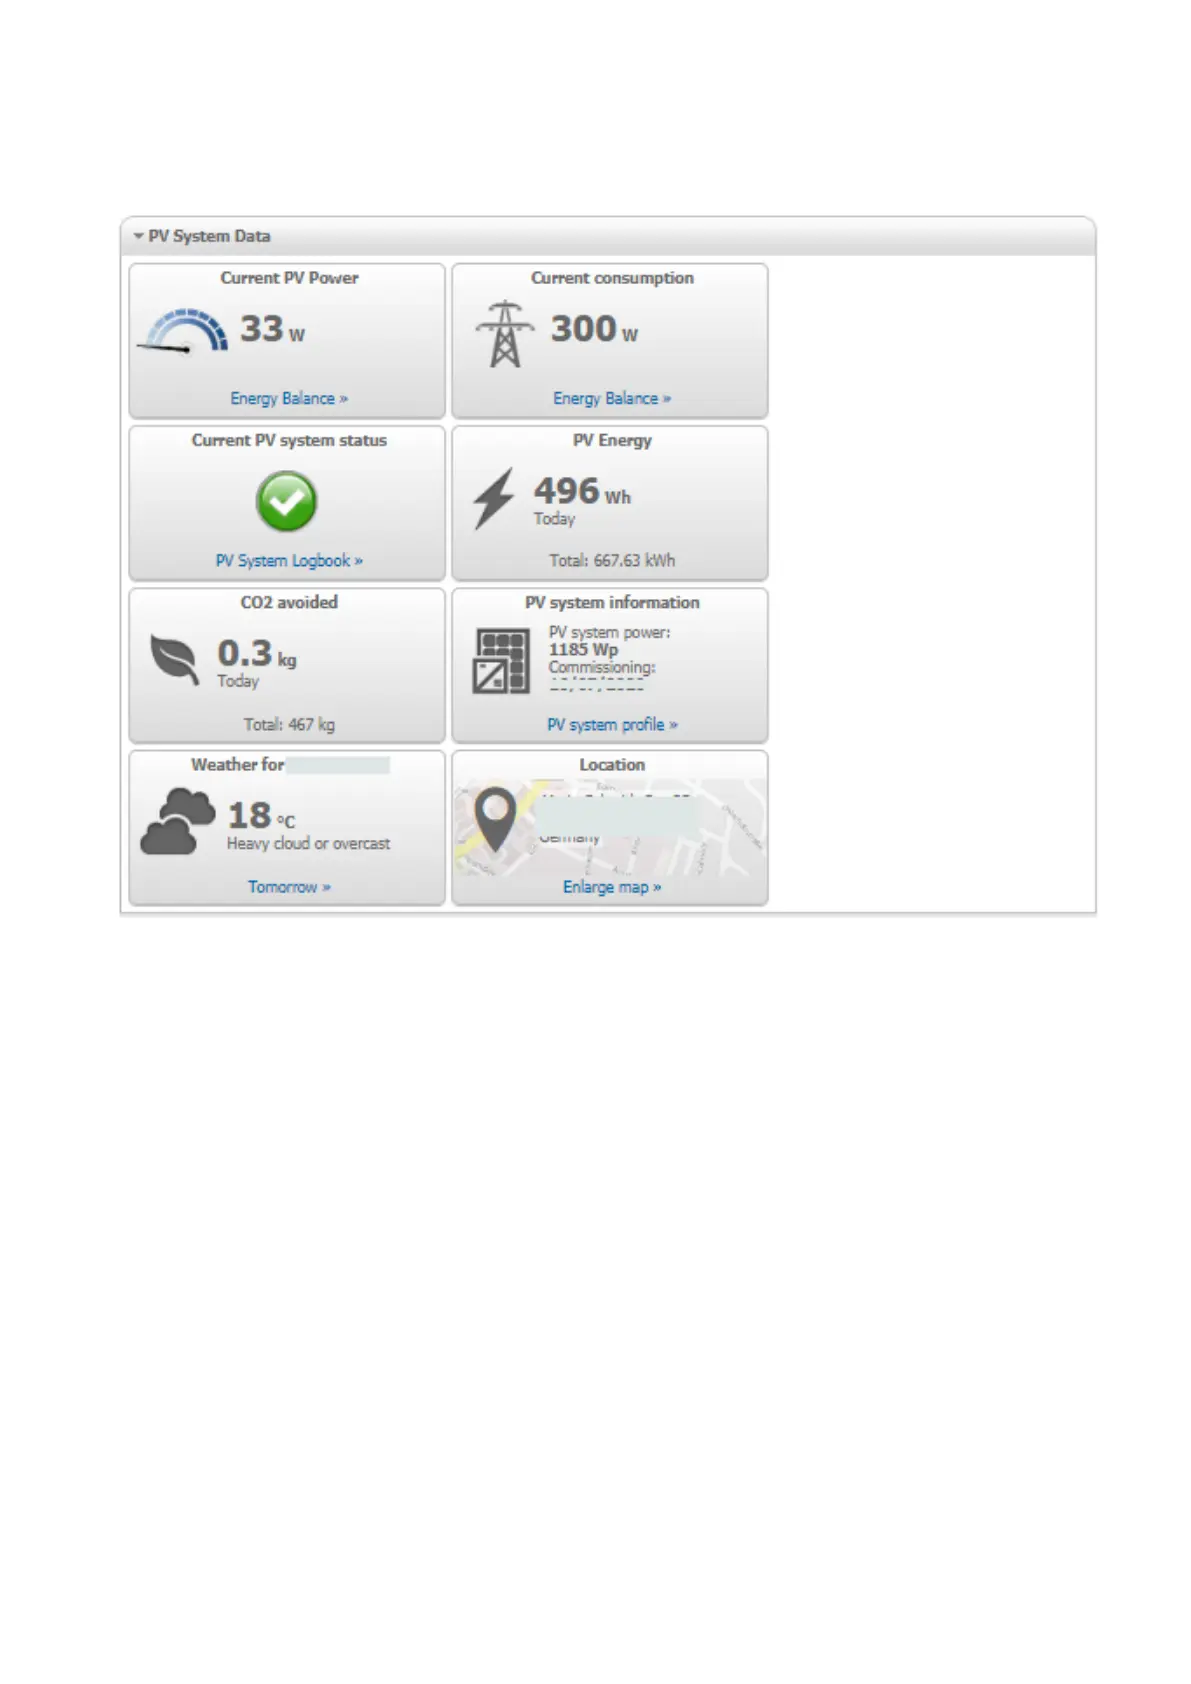
The menu page PV system overview shows all available data of your system.
Figure 16: Example of a system
13.3 Current Status And Forecast
The SunnyHomeManager continuously logs the energy generated by the PV system. The SunnyHomeManager
receives the PV generation data via the connected SMA inverters or via an optionally connected PV generation meter
(e.g. an SMAEnergyMeter). The SunnyHomeManager also receives location-based weather forecasts via the
Internet. Based on this information, the SunnyHomeManager forecasts how much energy your PV system will likely
generate in the next 48 hours and thus will be available.
The SunnyHomeManager includes the forecast of the energy availability in its energy planning and suggests cost-
effective operating times for home appliances, for example.
To query forecast information, in the Configuration menu on the System properties page under PV system data,
the following input fields must be completed:
• Longitude
• Latitude
• Nominal PV system power (necessary for the correct power forecast)
If one of the three entries is missing in the forecast area, either the weather symbols are not displayed, the power
forecast is not present or it is incorrect.
13.3.1 Overview Current Status Area
The graphic in the area Current Status visualizes the power transferred from your PV system to your household from the
utility grid to your household and from your PV system to the utility grid.