13 Visualization of the energy management
SMA Solar Technology AG
Operating manual 91HM-20-BE-en-19
Only for systems with self-consumption can be chosen between Option I and Option II.
For systems without self-consumption only Option I is possible and the configuration block is hidden.
Changing the display:
1. Select [Configuration - Current status and forecast] in the contents area on the page Current status and
forecast.
2. Select the desired option in the field Display.
3. Confirm the selection with [Save].
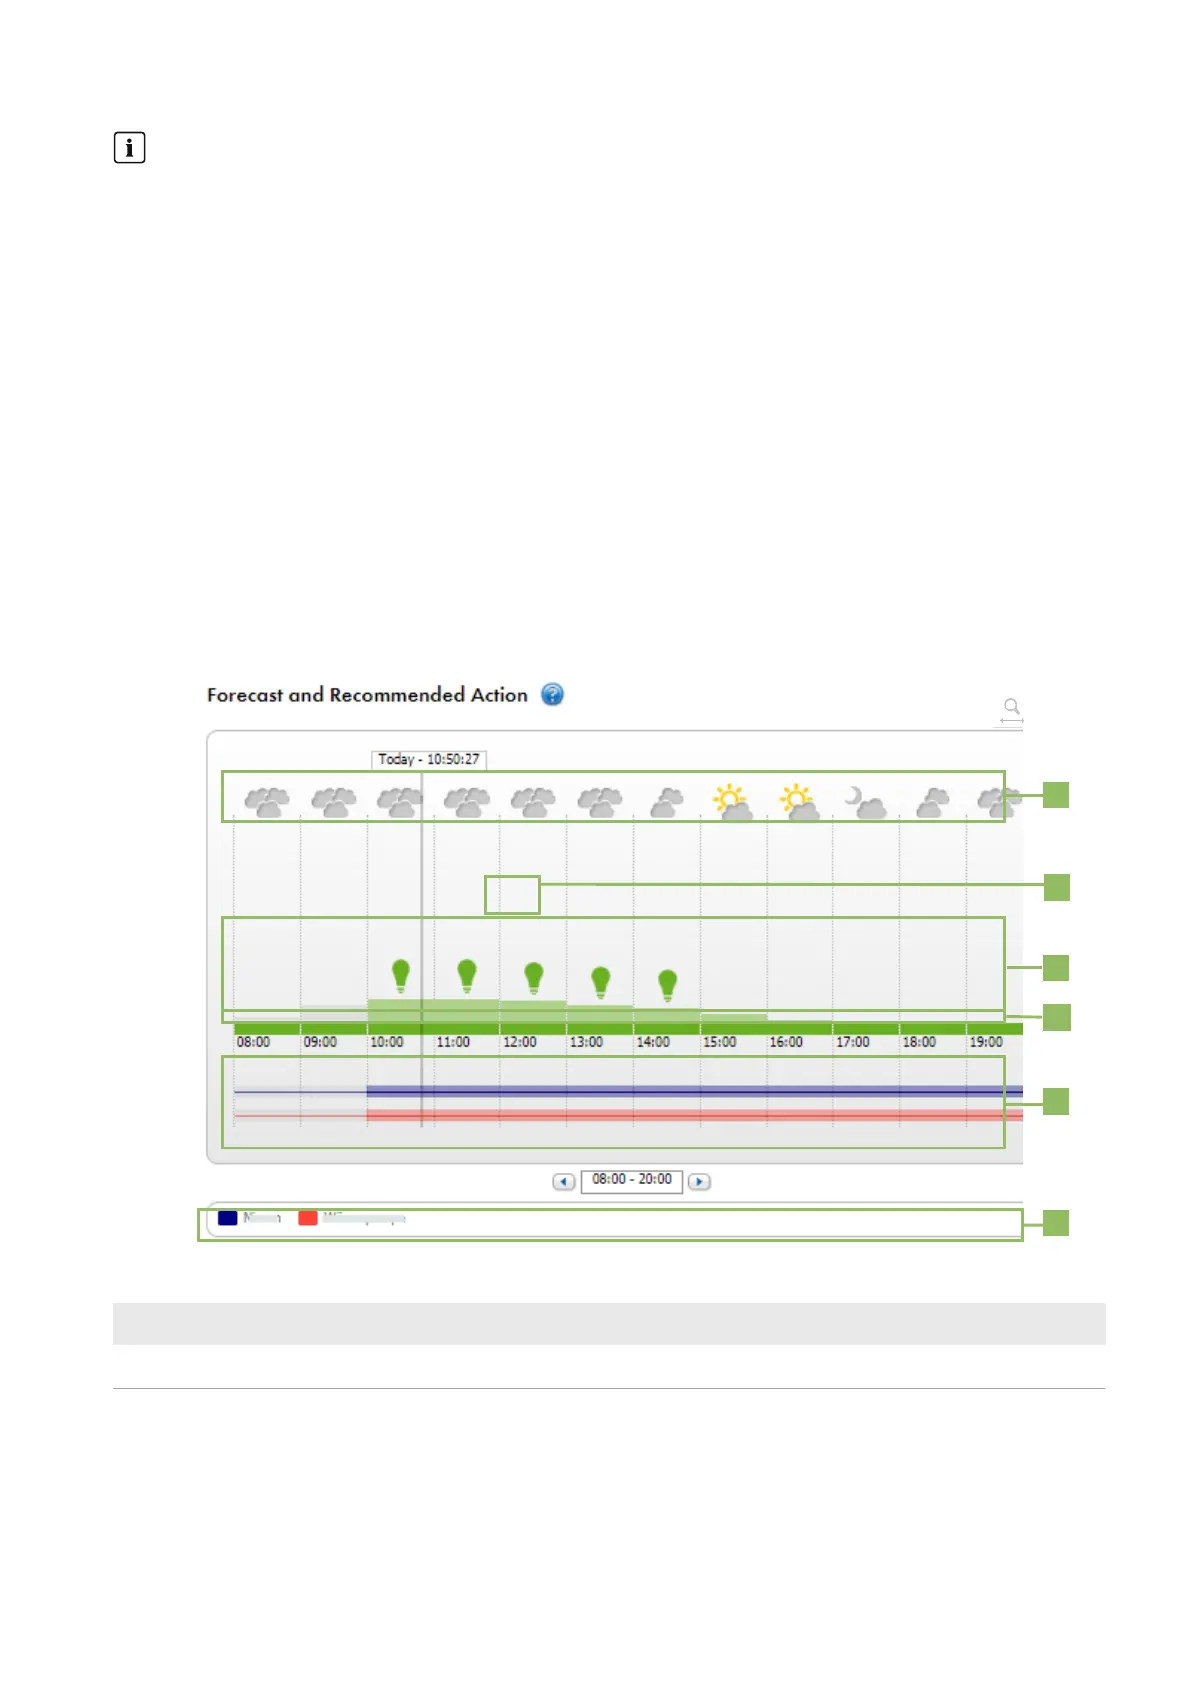
13.3.2 Overview Forecast and Recommended Action Area
The graphic in the area Forecast and Recommended Action gives an overview of the expected PV power as well as
recommendations on the manual switching-on of loads.
In addition the graphic shows the time periods that you have planned for the operation of the loads (see Section12.5,
page84).
A vertical gray line indicates the current time.
Using the magnifying glass icon in the upper right corner, you can extend the displayed forecast period to 36 hours.
With the 12-hour time section displayed by default, you can select a different time section either by clicking on the
diagram with the mouse and moving the mouse to the right or left while holding down the left mouse button, or by
using the arrow keys under the diagram to move the time section in steps of 3 hours at a time.
Figure 18: Forecast and Recommended Action diagram (example)
Position Explanation
A Weather forecast