Basic Applications-2230 Operators
Substituting these values into the equation:
Phase
Shift
(degrees)
Slope
6.3x10-
3
s
-----
X 360° = 65.17°
34.8x10-
3
s
The slope of a particular portion of a waveform
is
the
rate of change of voltage with respect to time. The follow-
ing procedure
is
useful for making the measurements
required for determining the slope of a portion of a
waveform.
1 . Preset instrument controls
and
obtain a baseline
trace.
2.
Set the STORE/NON STORE switch to the STORE
position (button
in).
3.
Set the VOL TS/DIV switch to obtain about 5 divi-
sions of vertical amplitude.
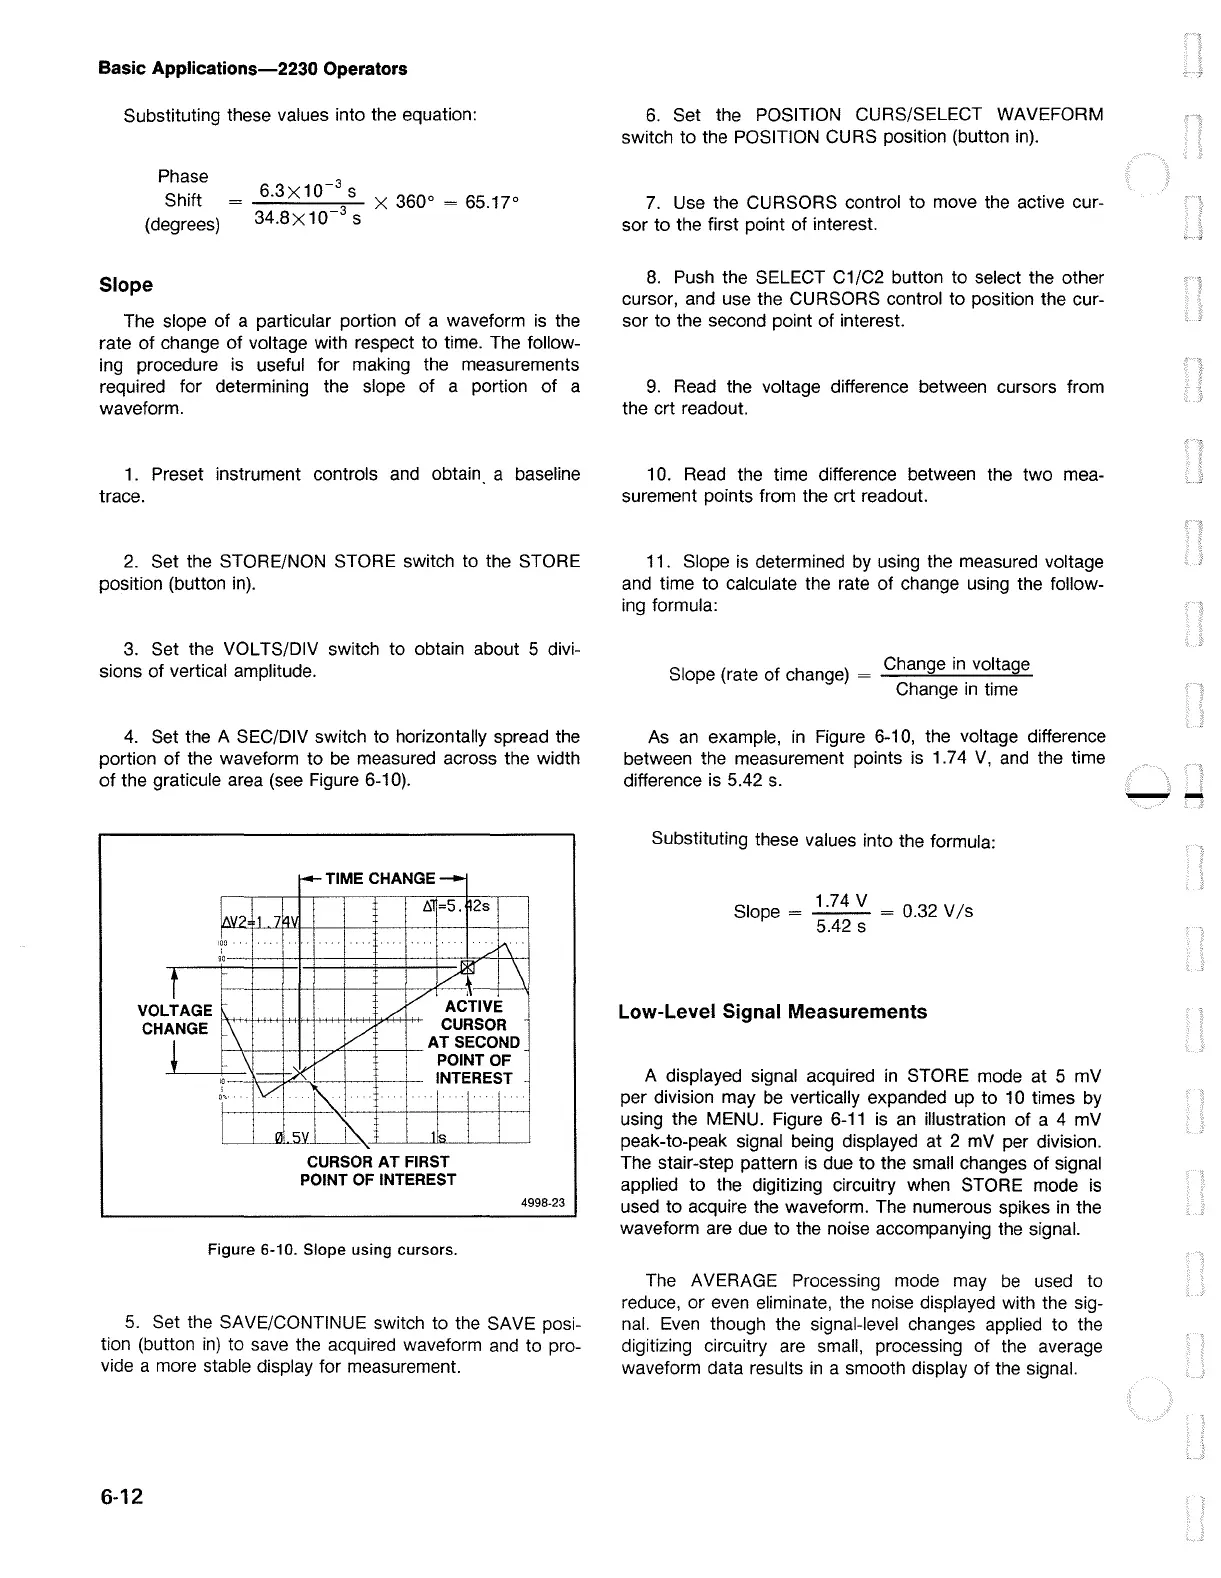
4.
Set the A SEC/DIV switch to horizontally spread the
portion of the waveform to
be
measured across the width
of
the graticule area
(see
Figure 6-10).
CURSOR AT FIRST
POINT OF INTEREST
Figure 6-10. Slope
using
cursors.
4998-23
5.
Set the SAVE/CONTINUE switch to the SAVE posi-
tion (button
in)
to save the acquired waveform
and
to pro-
vide a more stable display for measurement.
6-12
6.
Set the POSITION CURS/SELECT WAVEFORM
switch to the POSITION CURS position (button
in).
7.
Use
the CURSORS control to move the active cur-
sor to the first point of interest.
8.
Push
the SELECT
C1
/C2 button to select the other
cursor,
and
use the CURSORS control to position the cur-
sor to the second point of interest.
9.
Read the voltage difference between cursors from
the crt readout.
10.
Read
the time difference between the two mea-
surement points from the crt readout.
11
. Slope
is
determined
by
using the measured voltage
and
time to calculate the rate of change using the follow-
ing formula:
Slope (rate of change) = Change
in
voltage
Change
in
time
As
an
example,
in
Figure 6-10, the voltage difference
between the measurement points
is
1.74
V,
and
the time
difference
is
5.42
s.
Substituting these values into the formula:
1.74 V
Slope =
--
= 0.32 V
/s
5.42 s
Low-Level Signal Measurements
A displayed signal acquired
in
STORE mode at 5 mV
per division may
be
vertically expanded up to
10
times
by
using the MENU. Figure
6-11
is
an
illustration of a 4 mV
peak-to-peak signal being displayed at 2
mV
per division.
The stair-step pattern
is
due to the small changes of signal
applied to the digitizing circuitry when STORE mode
is
used to acquire the waveform. The numerous spikes
in
the
waveform are due to the noise accompanying the signal.
The AVERAGE Processing mode may
be
used to
reduce, or even eliminate, the noise displayed with the sig-
nal.
Even
though the signal-level changes applied to the
digitizing circuitry are small, processing of the average
waveform data results
in
a smooth display of the signal.
--
 Loading...