Results Screen
81
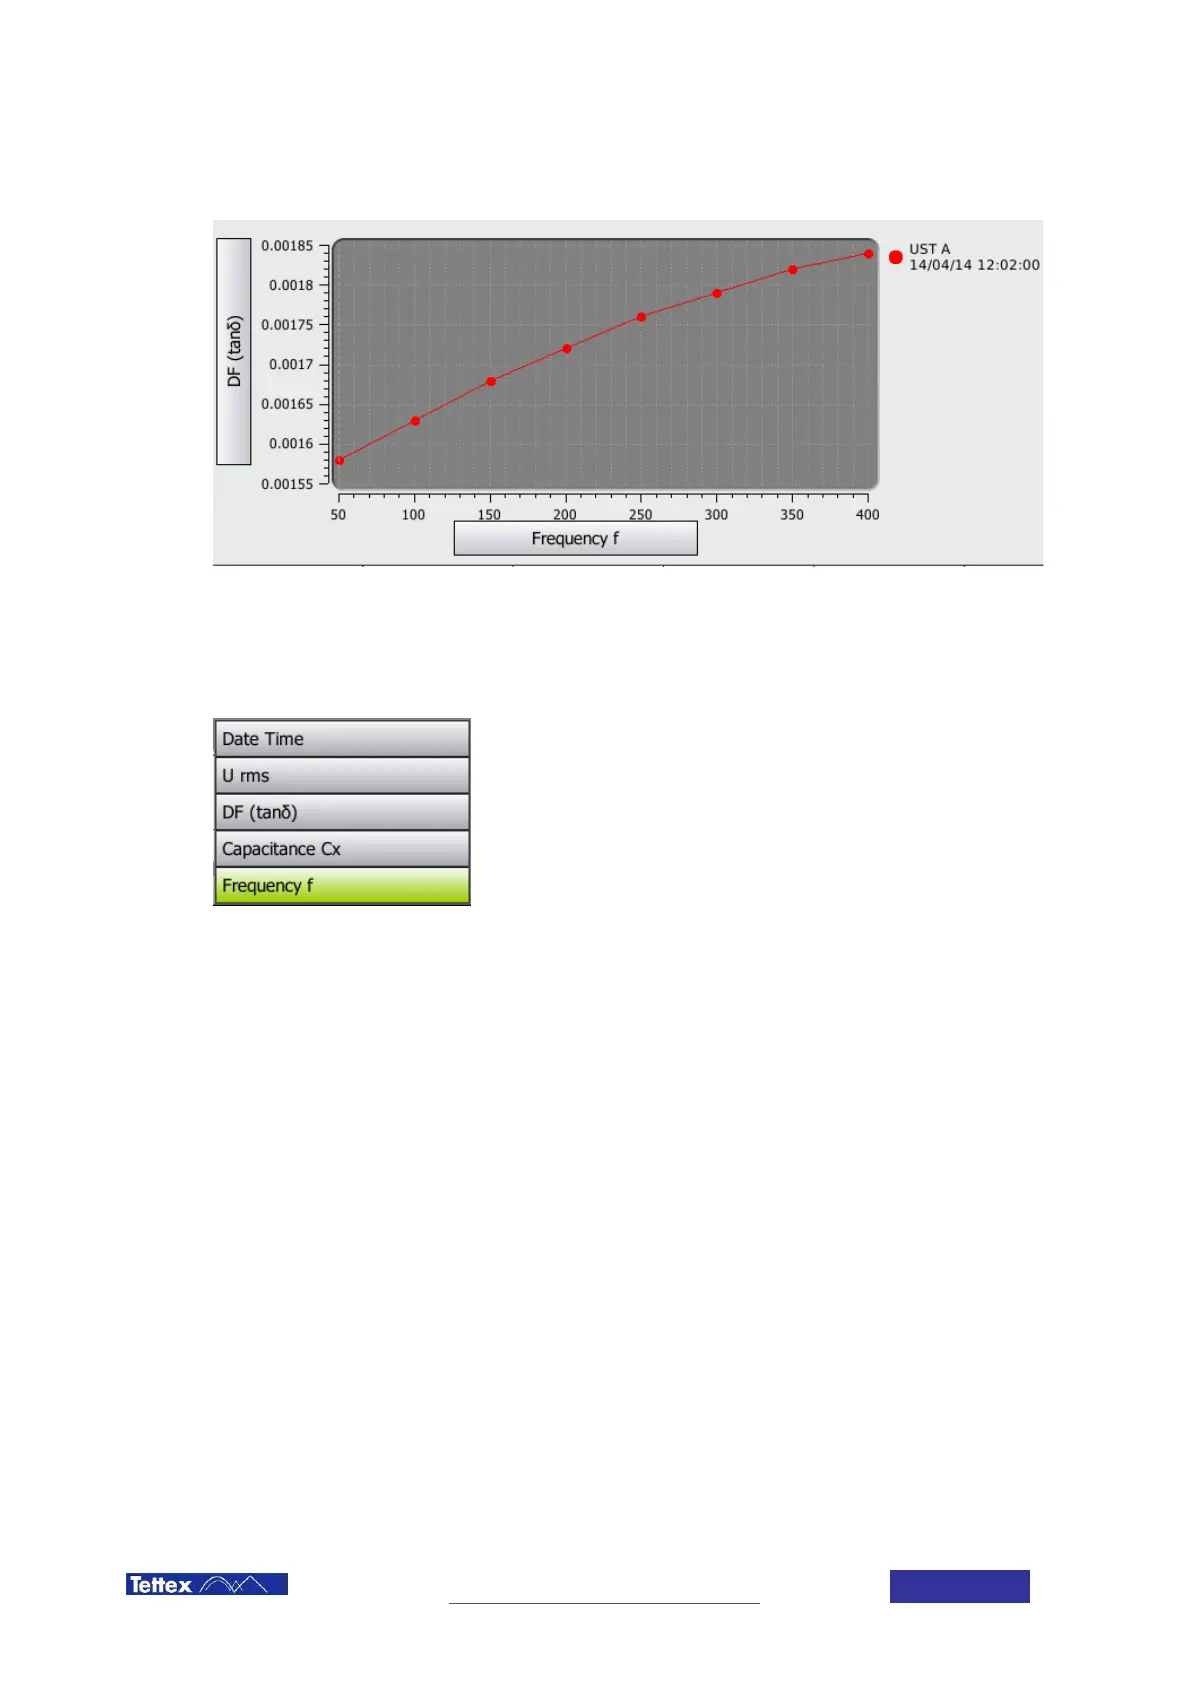
13.2.2 The Graph
The graph area with the y axis selector on the left side, the x axis selector at the bottom and the legend at the right
side.
The button on the left indicates the content of the y axis (here DF), the button on the bottom indicates the content
of the x axis (here Frequency). Pressing one of these buttons will open a list of available measurement values.
The values available for selection correspond to the selected columns in the Table tab. If you want to display a
value which is not listed you have to switch to the Table tab and use the Select Columns menu to change
selection.
The Legend on the right side shows which colour is assigned to which measurement.