13 Results Screen
The results screen lets you analyze the actual and previous measurements (when saved). It is composed of two
tabs. The table tab shows a listing of all the results. The graph tab shows a graph of selected measurements. The
results screen is a powerful tool to analyze the measurement results onsite. It allows the user to detect errors or
irregularities in test setup. Detecting errors onsite or even during a measurement sequence allows to repeat the
test with little effort.
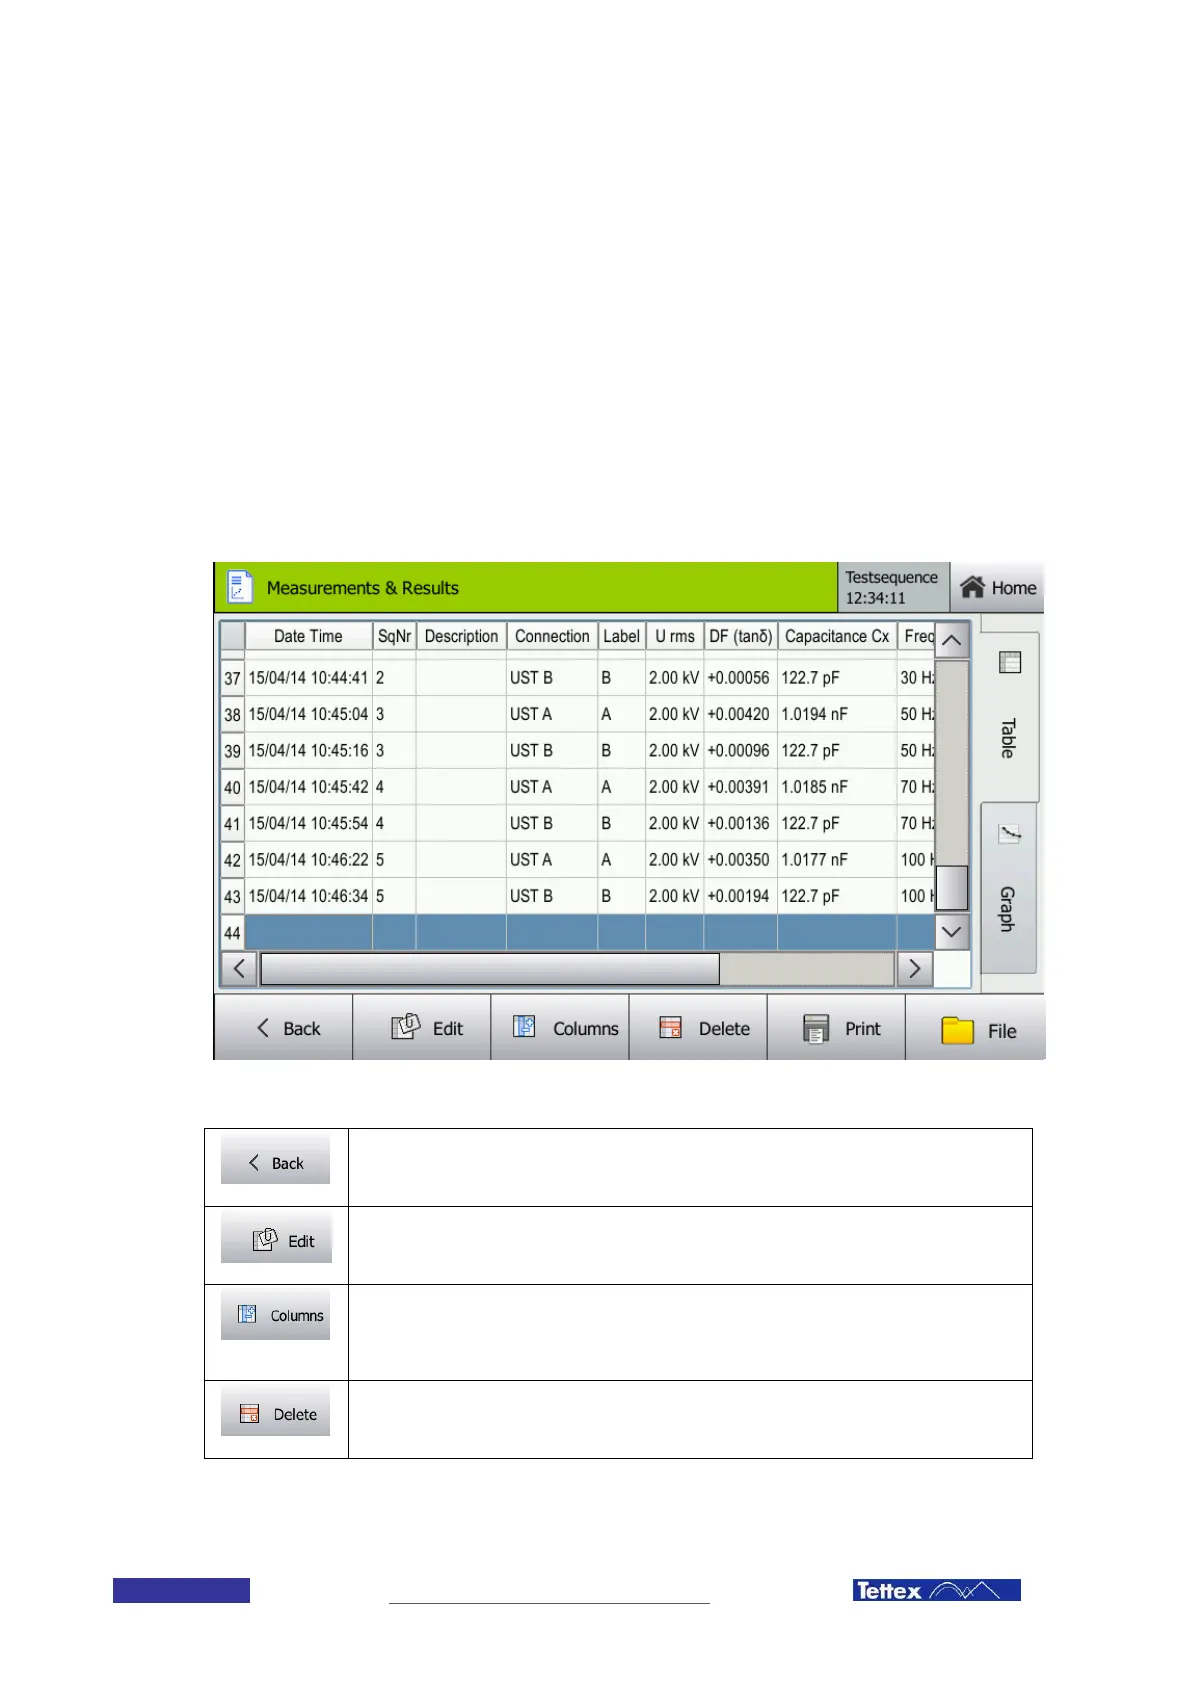
13.1 The Table Tab
The table tab lists all the measured values in a table. You can select the columns of measurement values which
should be displayed. Comments can be edited or measurement values deleted or printed.
The table tab of the results screen
Back Button
Leads back to the last screen (only available in Guided Mode)
Edit Button
Edits the comment for the marked line(s).
Select Columns Button
Allows the user to select which measurement values should be displayed. Opens a dialog
window. See chapter 13.1.2 Select Columns Dialog for further instructions.
Delete Row Button
Deletes the selected row(s).