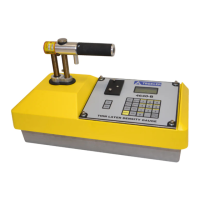
At the Projects menu shown on page 8–2, press 〈5〉. The gauge
request the output format as shown:
The 32 Column Report option is formatted for a standard printer
width. This format is recommended when outputting the data to a
printer. The Spreadsheet option is sent in a comma-delimited
format, which can then be imported easily into a spreadsheet
program, such as Microsoft Excel. Figure 8–1 defines the
information contained in each column of the spreadsheet.
Press 〈1〉 or 〈2〉 to select the desired output format. The gauge
displays:
From this menu, the gauge can print (or upload) either a single
project or all projects.
To output a single project, press 〈1〉. The gauge displays:
Use the arrow keys to scroll through the project names
displayed on the first line. When the gauge displays the desired
project, press
〈ENTER/START〉.
To output the data from all projects, press 〈2〉.
The gauge prints (or uploads) the selected project(s) and returns to
the Projects menu shown on page 8–2
. Press the 〈ESC〉 key to
return to the Ready screen.
 Loading...
