10-23
IM 701310-01E
Analysis and Search
3
2
1
4
5
6
7
8
9
10
11
12
13
14
15
16
17
18
19
App
Index
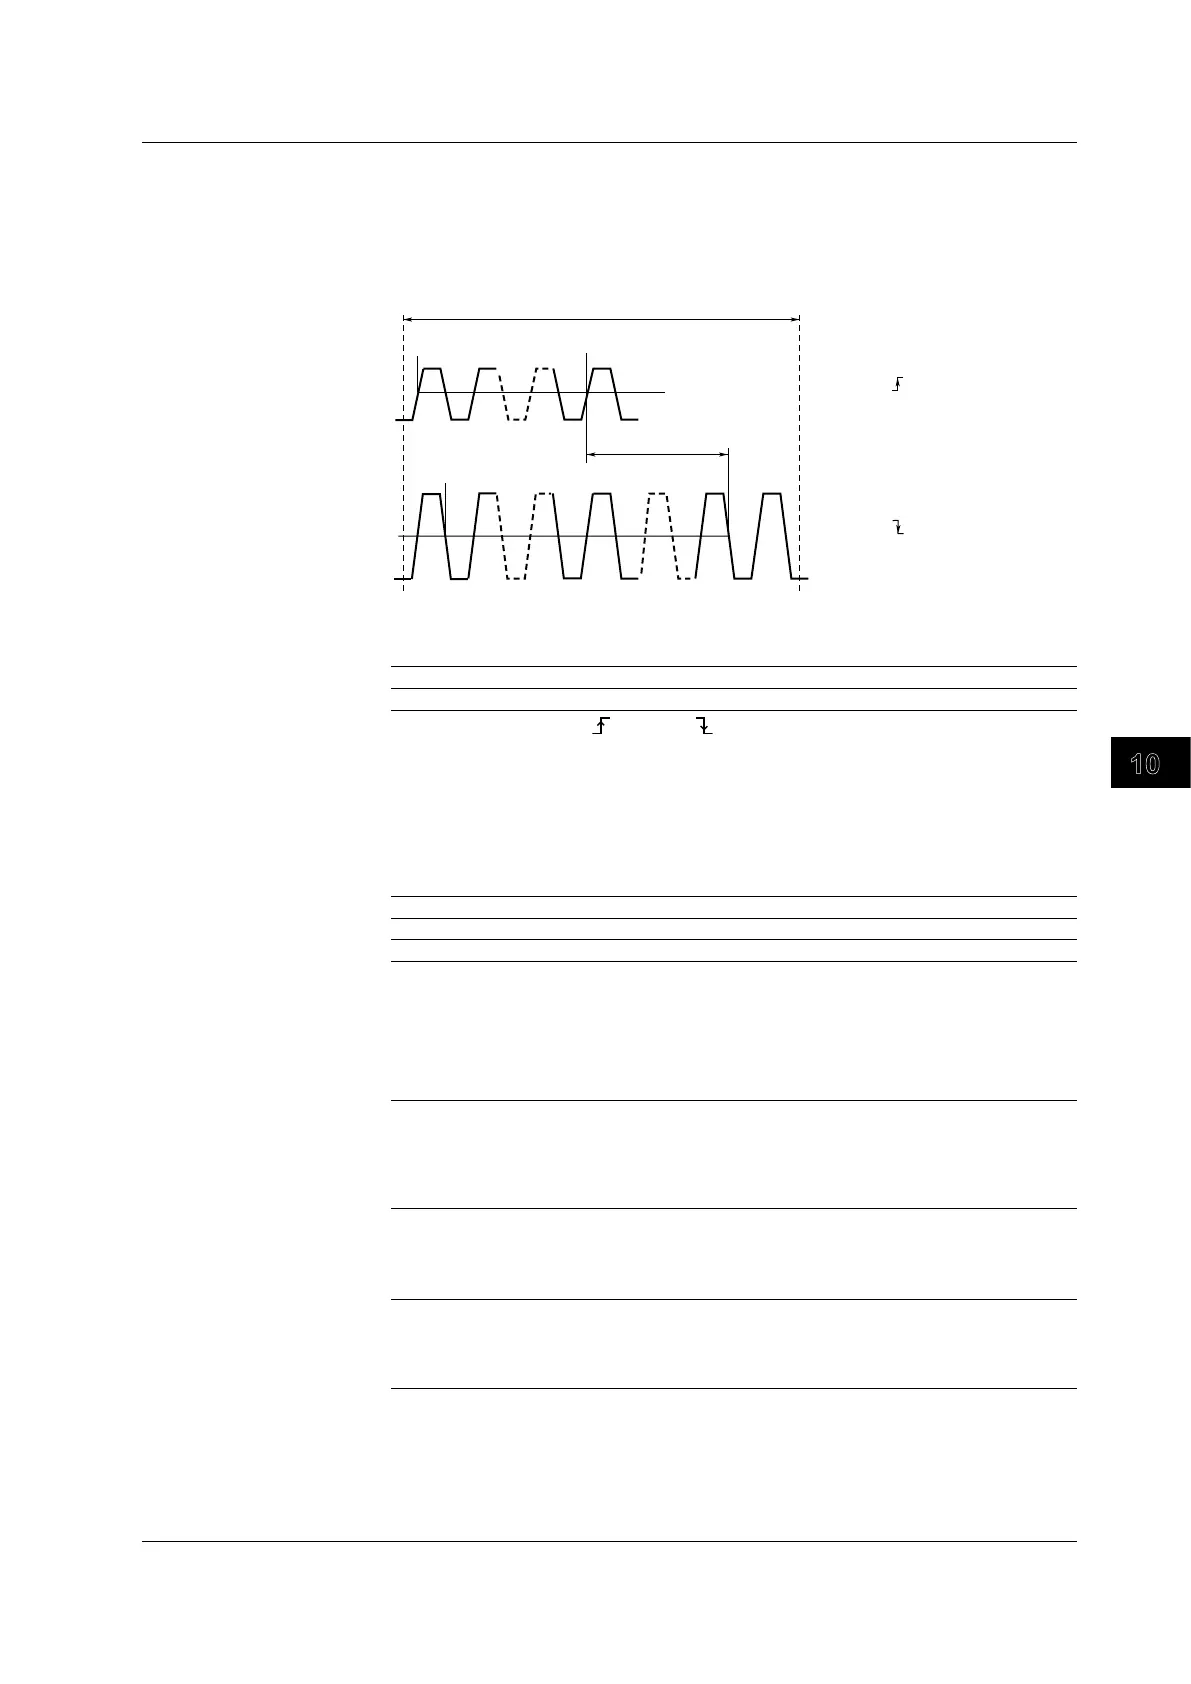
Setting the Delay
Measures the delay between waveforms or the delay from the trigger point to the rising
or falling edge.
The following figure shows the case when the reference waveform polarity is set to rising
edge and the reference point is set to Edge.
: (rising edge)
: N1 (an integer from 1 to 10)
: (falling edge)
: N2 (an integer from 1 to 10)
Reference waveform
(Reference)
Source waveform
(Measure)
Count 1
Count N1
Count N2
Count 1
Delay between waveforms
• Polarity
• Count
Example of reference waveform settings
Example of source waveform settings
Time range
• Polarity
• Count
Delay reference line
• The reference point that is used to measure the delay between waveforms varies
depending on the Reference setting.
Edge Based on the reference waveform edge
Trig Pos Based on the trigger position
• Set the detected edge to (rising) or (falling) using the Edge Polarity item. The
default setting is rising edge.
• Set the number of edges to specify the detection point (referen
ce point or
measurement point) using the Count item. Set an integer value from 1 to 10. The
default value is 1.
•
The voltage level at the detection point defines the delay refer
ence line.
• The delay reference line varies depending on the threshold level setting as follows:
Auto 50% of the peak-to-peak value or high-low value
Level/Hys The specified threshold level
Upper/Lower (Upper – Lower)/2
• The measured delay is displayed using the name “Dly.”
How to Determine the High and Low Values
You can select how the DL9000 determines the high level (100%) and the low level (0%)
for the high, low, hi-low, and rise/fall measurement items.
Auto
Sets the high value to the high amplitude level and the low value to the low amplitude level to
low based on the voltage level frequency of the source waveform in the time range taking into
account the effects from ringing, spikes, etc. This method is suitable for measuring square waves
and pulse waves.
Histgram
Sets the levels of the two highest frequencies on a histogram to high and low.
This method is suitable for waveforms whose maximum frequency of a given level is extremely
high compared to frequencies of other levels, such as in a rectangular waveform.
MAX-MIN
Sets high and low values to the maximum and minimum values in the time range. This method
is suitable for measuring sinusoidal and saw waves. It is not suitable for waveforms that have
ringing and spikes.
10.2 Performing Automated Measurement of Waveform Parameters
 Loading...