1-15
IM MV1000-01E
Feature Overview
1
2
3
4
5
6
7
8
9
10
11
12
13
App
Index
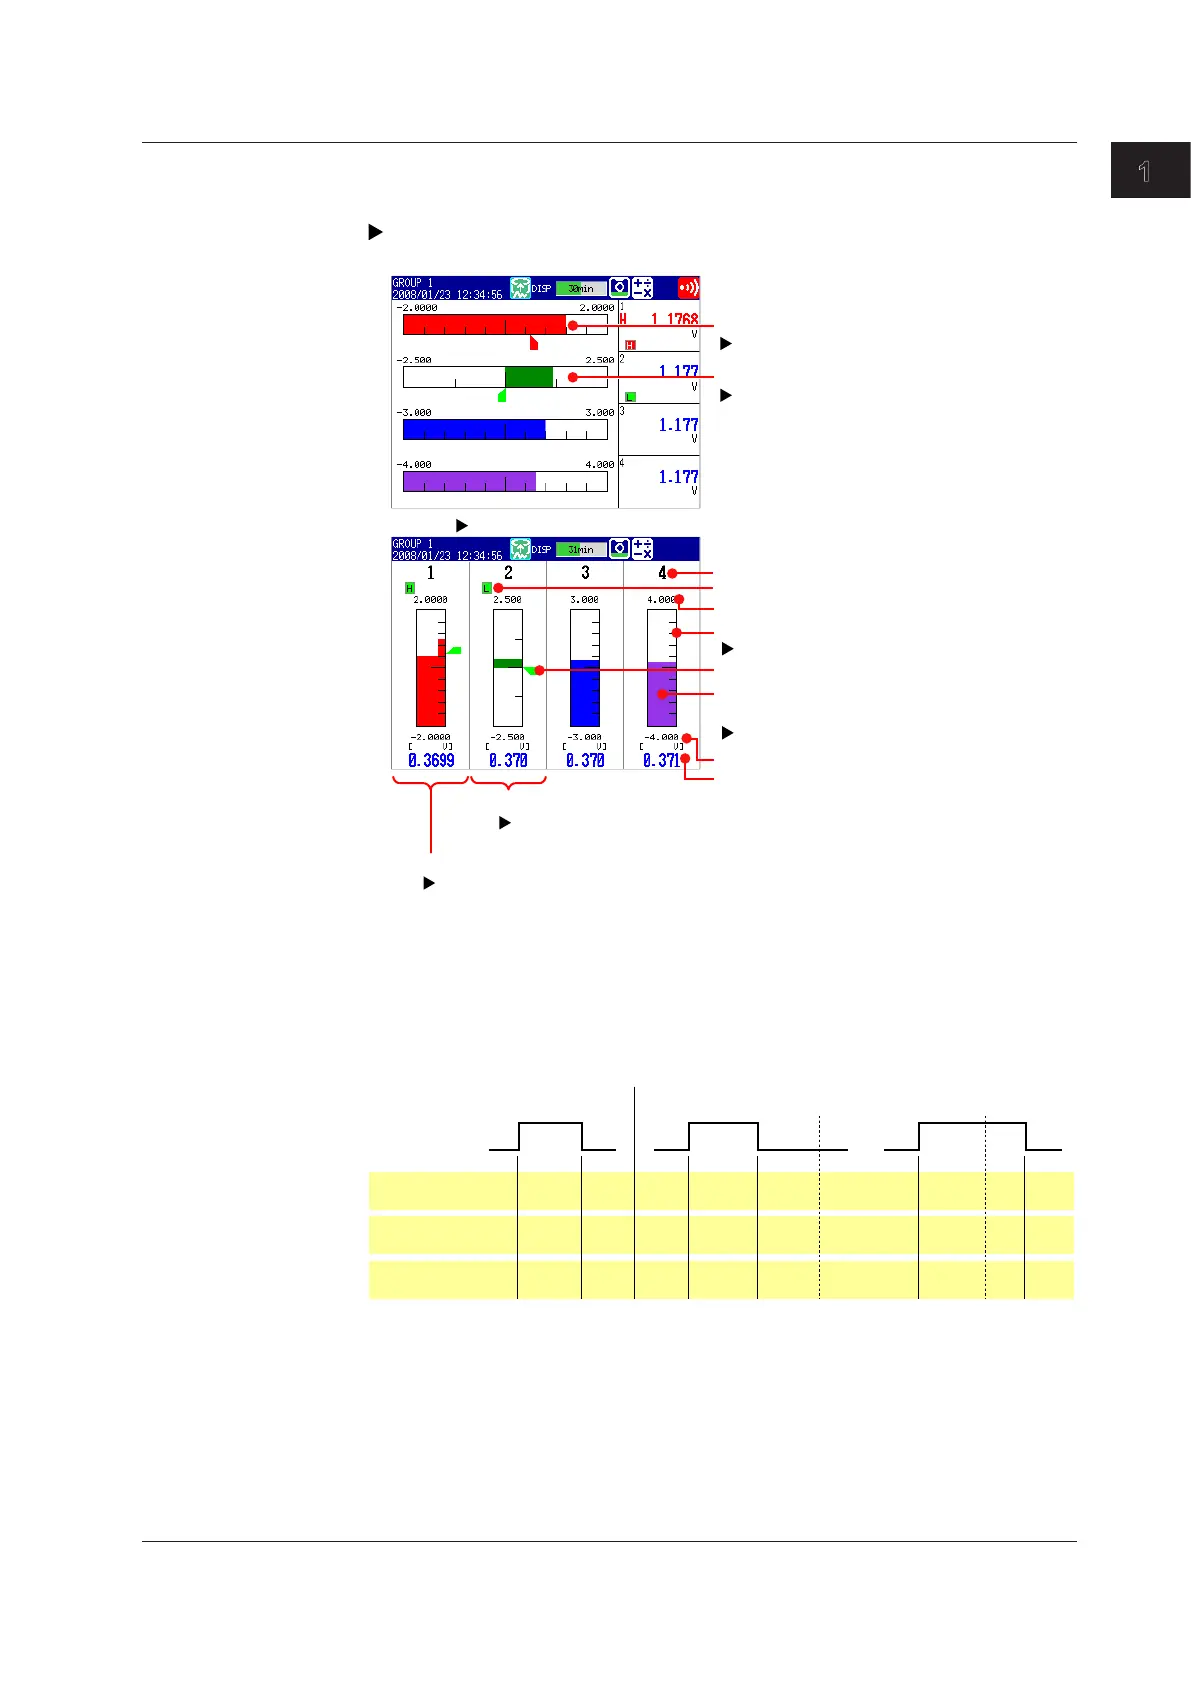
Bar Graph Display
Displays measured data using bar graphs.
For operating instructions, see section 5.2.
Horizontal
Vertical
Alarm value mark
Scale
Bar
(displayed with the set channel color)
Measured value
Unit of measurement and minimum value
Maximum value
Tag name or channel number
The bar graph base position is set to Normal,
Lower, or Upper.
Section 6.11
The bar graph base position is set to Normal, Lower, or Upper.
Section 6.11
The bar graph base position is set to Center.
Section 6.11
Section 6.7
Section 6.11
Section 6.10
The bar graph base position is set to Center.
Section 6.11
Alarm mark
• Bar Graph Display Updating
The bar graph display is updated at the same rate as numeric values.
• Alarm Display
The alarm mark, alarm value mark, and measured values are displayed in the
following ways, depending on the alarm condition.
Alarm
Release
Red Green Red
Green Red RedGreen Green Green Green Green
AlarmACK AlarmACK
Occurrence
Indication not held Indication held
Value mark
Red Blue Red
Blue Red RedBlue Blue Blue Blue Blue
Measured
value
Blinking
red
Blinking
green
Blinking
red
Green Red RedGreen Green GreenGreen Green
Alarm mark
1.4 Display
 Loading...