5-6 IM 760301-01E
Measurement Functions of Normal Measurement
• Symbol and Meaning of the Displayed Measurement Functions
U (voltage Urms, Umn, Udc, Urmn), I (current Irms, Imn, Idc, Irmn)
P (active power), S (apparent power)
Q (reactive power), λ (power factor)
φ (phase difference), fU/fI (or freqU/freqI voltage/current frequency)
U+pk/U-pk (voltage maximum/minimum), I+pk/I-pk (current maximum/minimum)
CfU/CfI (voltage/current crest factor), Pc (corrected power)
WP (watt hour, sum of positive and negative watt hours), WP+ (positive watt hour consumed)
WP- (negative watt hour returned to the power supply), q (ampere hour, sum of positive and negative ampere hours)
q+ (positive current hour consumed), q- (negative current hour returned to the power supply)
WS (volt-ampere-hour), WQ (var-hour)
Time (integration time), η1 to η4 (efficiency)
F1 to F20 (user-defined functions), ∆F1 to F4 (delta computation: option)
Speed*(rotating speed), Torque*
Pm* (motor output, mechanical power), SyncSp* (synchronous speed)
Slip,*
and the measurement functions of harmonic measurement (for details, see chapter 7 in the
Expansion Function
User’s Manual IM760301-51E
)
* Displayed on models with the motor version.
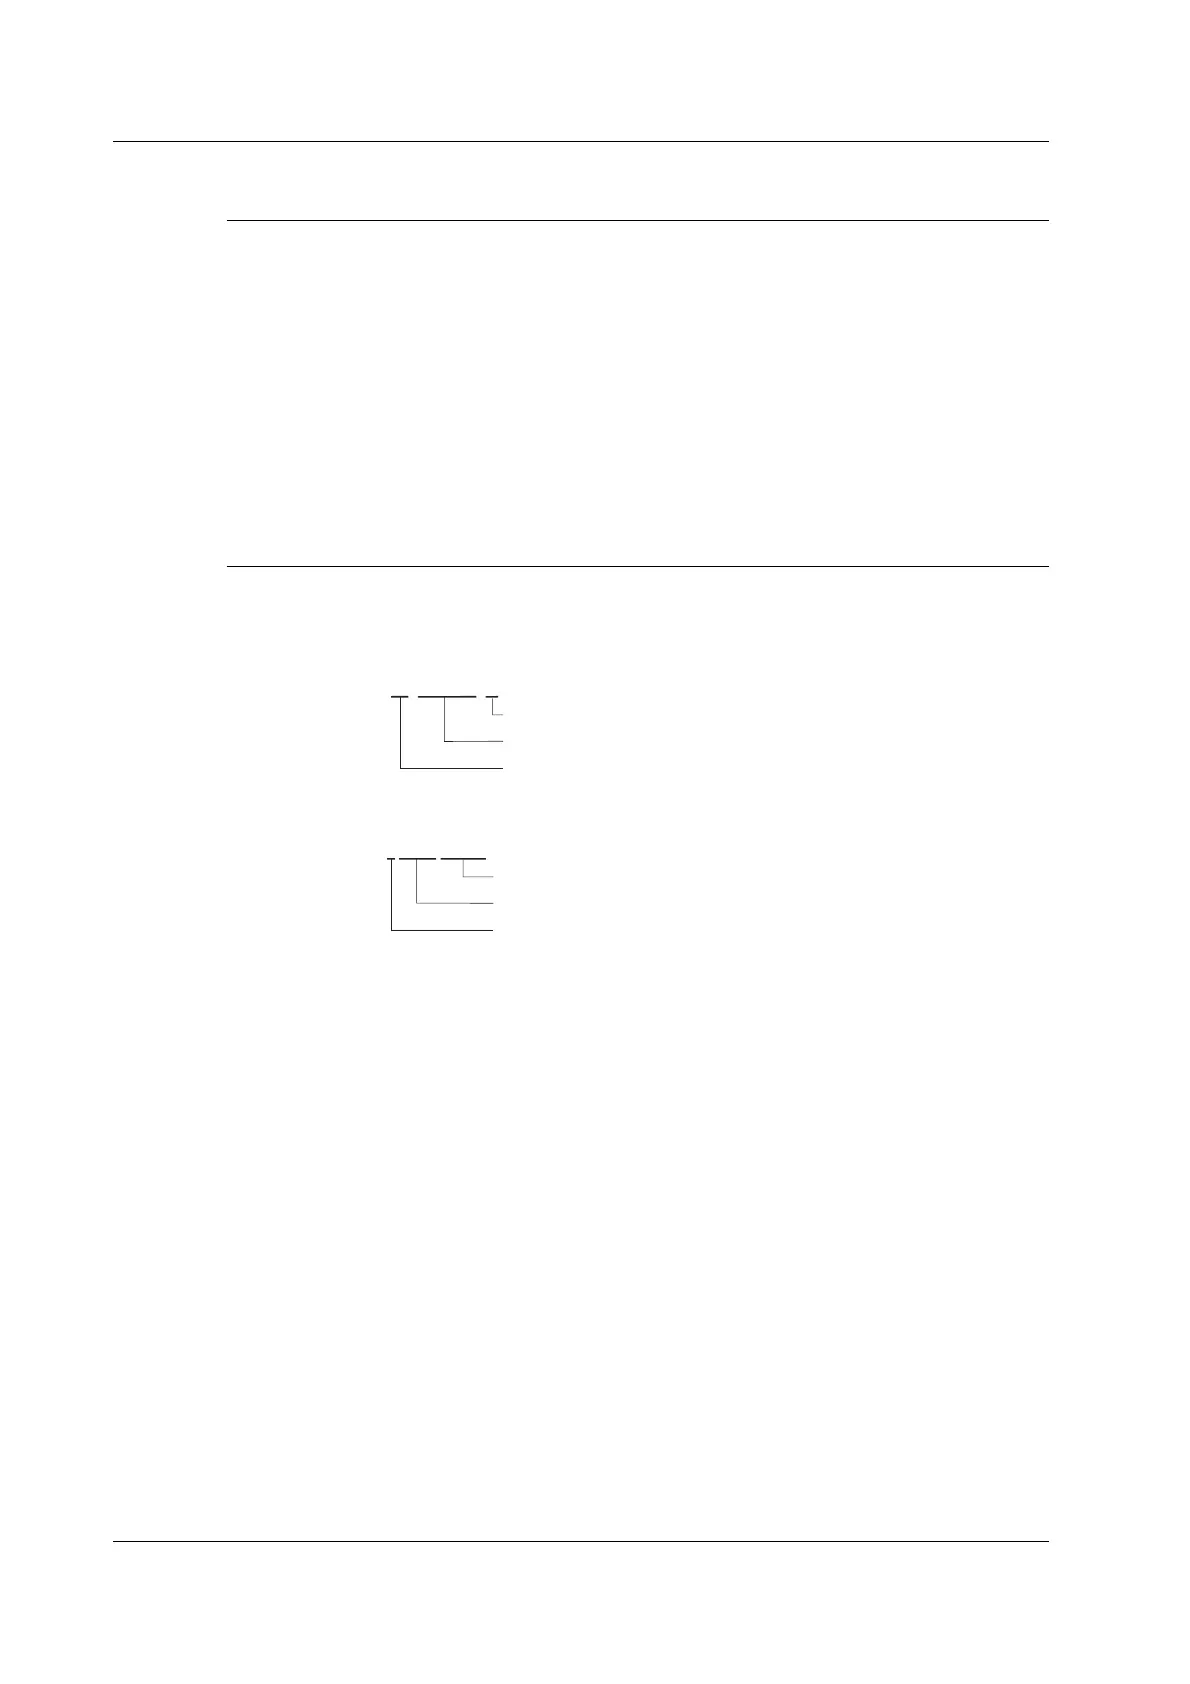
Example The True Rms Value of the Voltage of Element 1
Urms1
Element 1
True rms value
Voltage
Simple Average of the Current of the Elements Combined by Wiring Unit ΣA
IdcΣA
Σ function of wiring unit ΣA
Simple average
Current
• Selecting the Display Mode
Select the display format of the numeric data from below. [-------] (no data) is
displayed in places where the measurement function is not selected or where no
numeric data is present.
• Displaying the Numeric Data on the Entire Screen
Press the NUMERIC key to display the numeric data on the entire screen.
• Displaying Numeric Data by Dividing the Display into Halves (Split Display)
• Numeric+Wave
The numeric data and waveform are displayed separately in the top and bottom
windows. For details on setting the waveform display, see section 4.2 and
chapter 9.
• Numeric+Trend
The numeric data and trend are displayed separately in the top and bottom
windows. For details on setting the trend display, see section 4.5 and chapter 10.
• Numeric+Bar
This mode is selectable only on models with the advanced computation (/G6) or
harmonic measurement (/G5) option.
The numeric data and bar graph of harmonics are displayed separately in the
top and bottom windows. For details on how to set the bar graph display, see
the
Expansion Function User’s Manual IM760301-51E
.
5.1 Displaying Numeric Data and Changing the Displayed Items
 Loading...