2-24 IM 760301-01E
2.7 Waveform Display
The WT3000 displays waveforms based on the data sampled within the data update
rate.
Selecting the Waveform to Be Displayed «For procedures, see section 6.2.»
You can select whether to show or hide the voltage and current waveforms of each input
element. This feature enables easy viewing of waveforms as only the required
waveforms can be displayed.
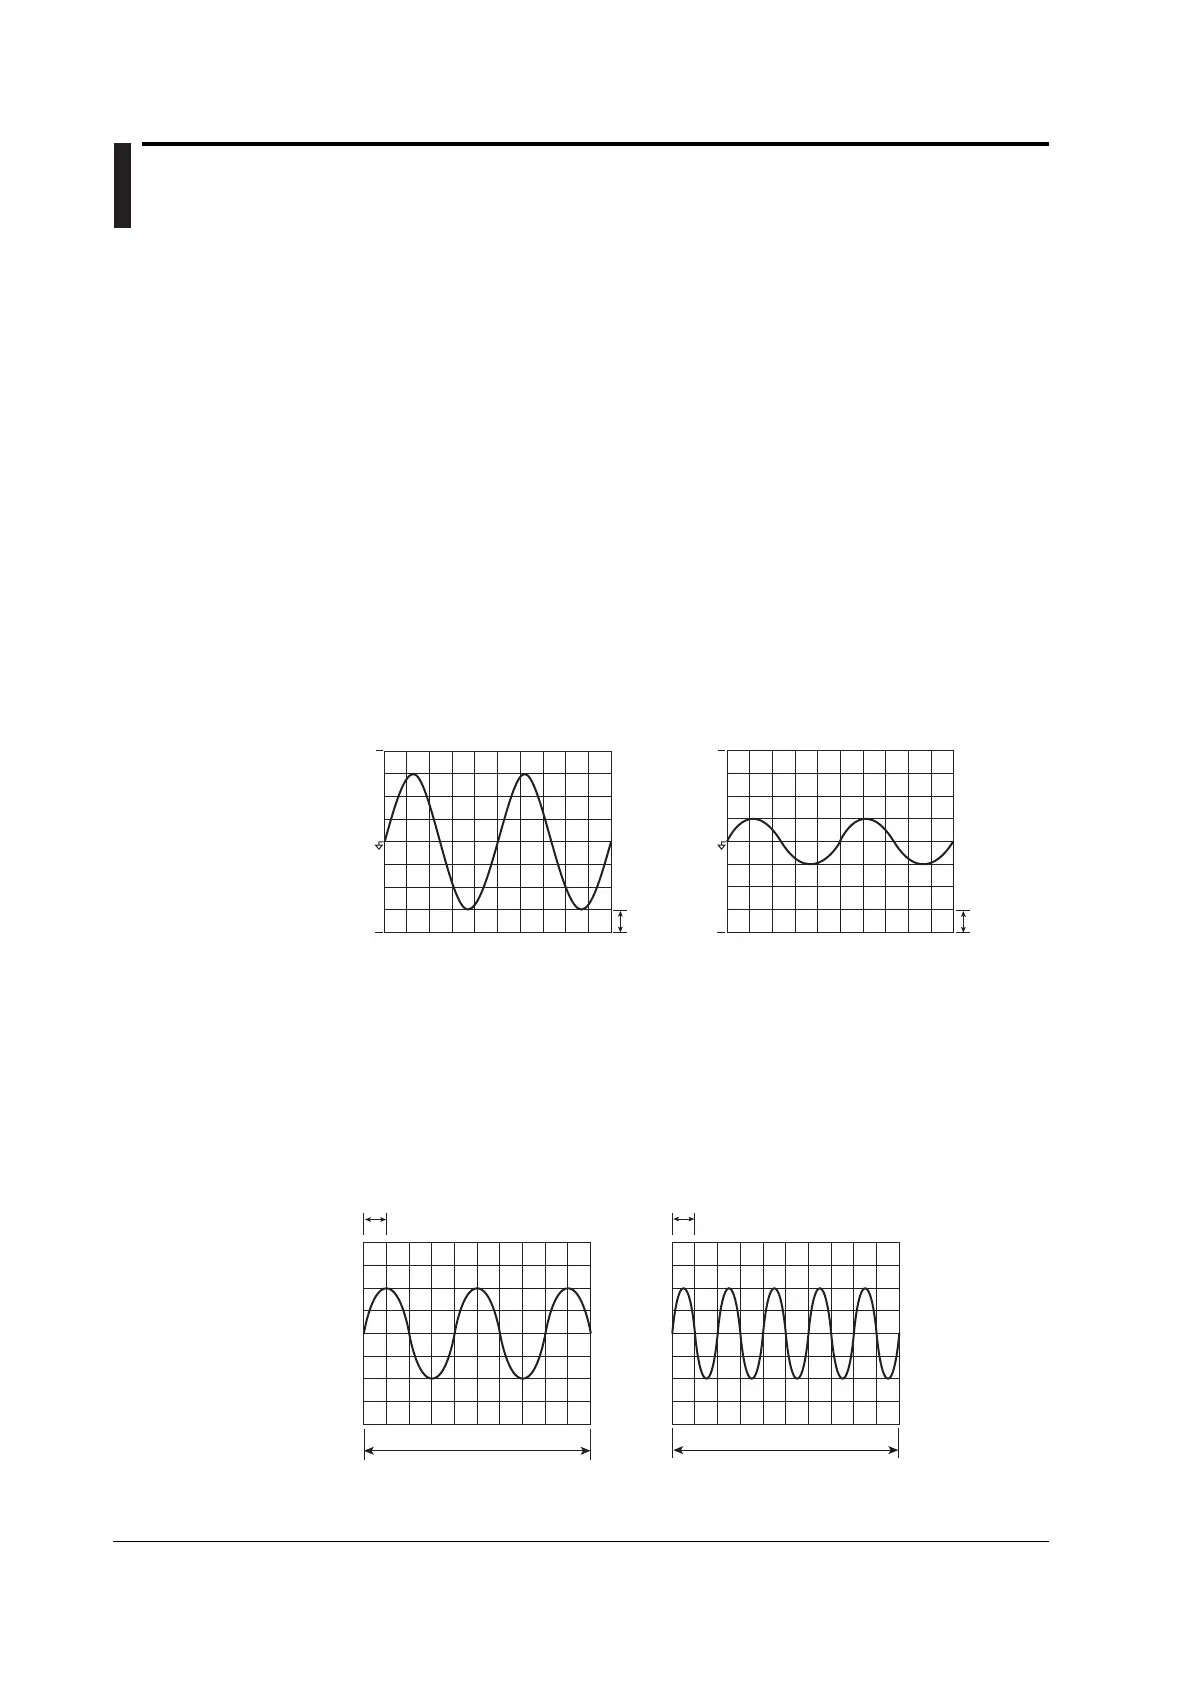
Vertical (Amplitude) Axis
The vertical display range is determined based on the specified measurement range. For
example, if the crest factor is set to 3 and the voltage measurement range is set to “100
Vrms,” then the display range is set so that the top of the screen is 300 Vpk (100 Vrms ×
3) and the bottom is –300 Vpk (–100 Vrms × 3) with the zero input line at the center. If
the crest factor is set to 6 and the voltage measurement range is set to “50 Vrms,” then
the display range is set so that the top of the screen is 300 Vpk (50 Vrms × 6) and the
bottom is –300 Vpk (–50 Vrms × 6) with the zero input line at the center. The waveform
clips if this range is exceeded.
1 grid (1 div.)
= 225 V
1 grid (1 div.)
= 75 V
When measured at the measurement
range of 100 Vrms
When the same signal is measured at
the measurement range of 300 Vrms
Input zero line
300 Vpk
–300 Vpk
900 Vpk
–900 Vpk
Horizontal (Time) Axis «For procedures, see section 6.3.»
Set the horizontal (time) axis by specifying the time per grid (1 division). The time axis
can be set in 1, 2, or 5 steps in the range up to the point in which the time
corresponding to one screen is equal to the data update rate. For example, if the data
update rate is 500 ms, the time per division can be changed in the order, 0.5 ms, 1
ms, 2 ms, 5 ms, 10 ms, 20 ms, and 50 ms. This allows the time of one screen to be
changed in the order, 5 ms, 10 ms, 20 ms, 50 ms, 100 ms, 200 ms, and 500 ms.
1 grid (1 div.) = 10 ms
1 grid (1 div.) = 20 ms
100 ms
(Observation time)
200 ms
(Observation time)
 Loading...