2-25
IM 760301-01E
2
Faunctional Description
Note
• Waveform sampling data and waveform display data (the number of displayed points
on the screen)
The waveform sampling data and waveform display data are both measured data of the
waveform, but they differ as described below.
Waveform sampling data: Data derived by making an A/D conversion of the input
signal
The A/D conversion rate is approximately 200 kS/s on the WT3000. Therefore, if the data
update rate is set to 1 s, the number of waveform sampling data points in a single
measurement is approximately 200,000 for an input signal (see the figure below). The
waveform sampling data is also called acquisition data or raw wave data.
Waveform display data: Waveform display data on the WT3000 screen (1002 points)
When displaying waveforms on the WT3000, data points are displayed in horizontal rasters
(along the time axis). The number of rasters is 501. Each raster contains two points of
waveform display data. The two data points are the maximum and minimum values of the
waveform data in each raster. Therefore, the number of waveform display data points (the
number of points displayed on the screen) is 1002 for an input signal.
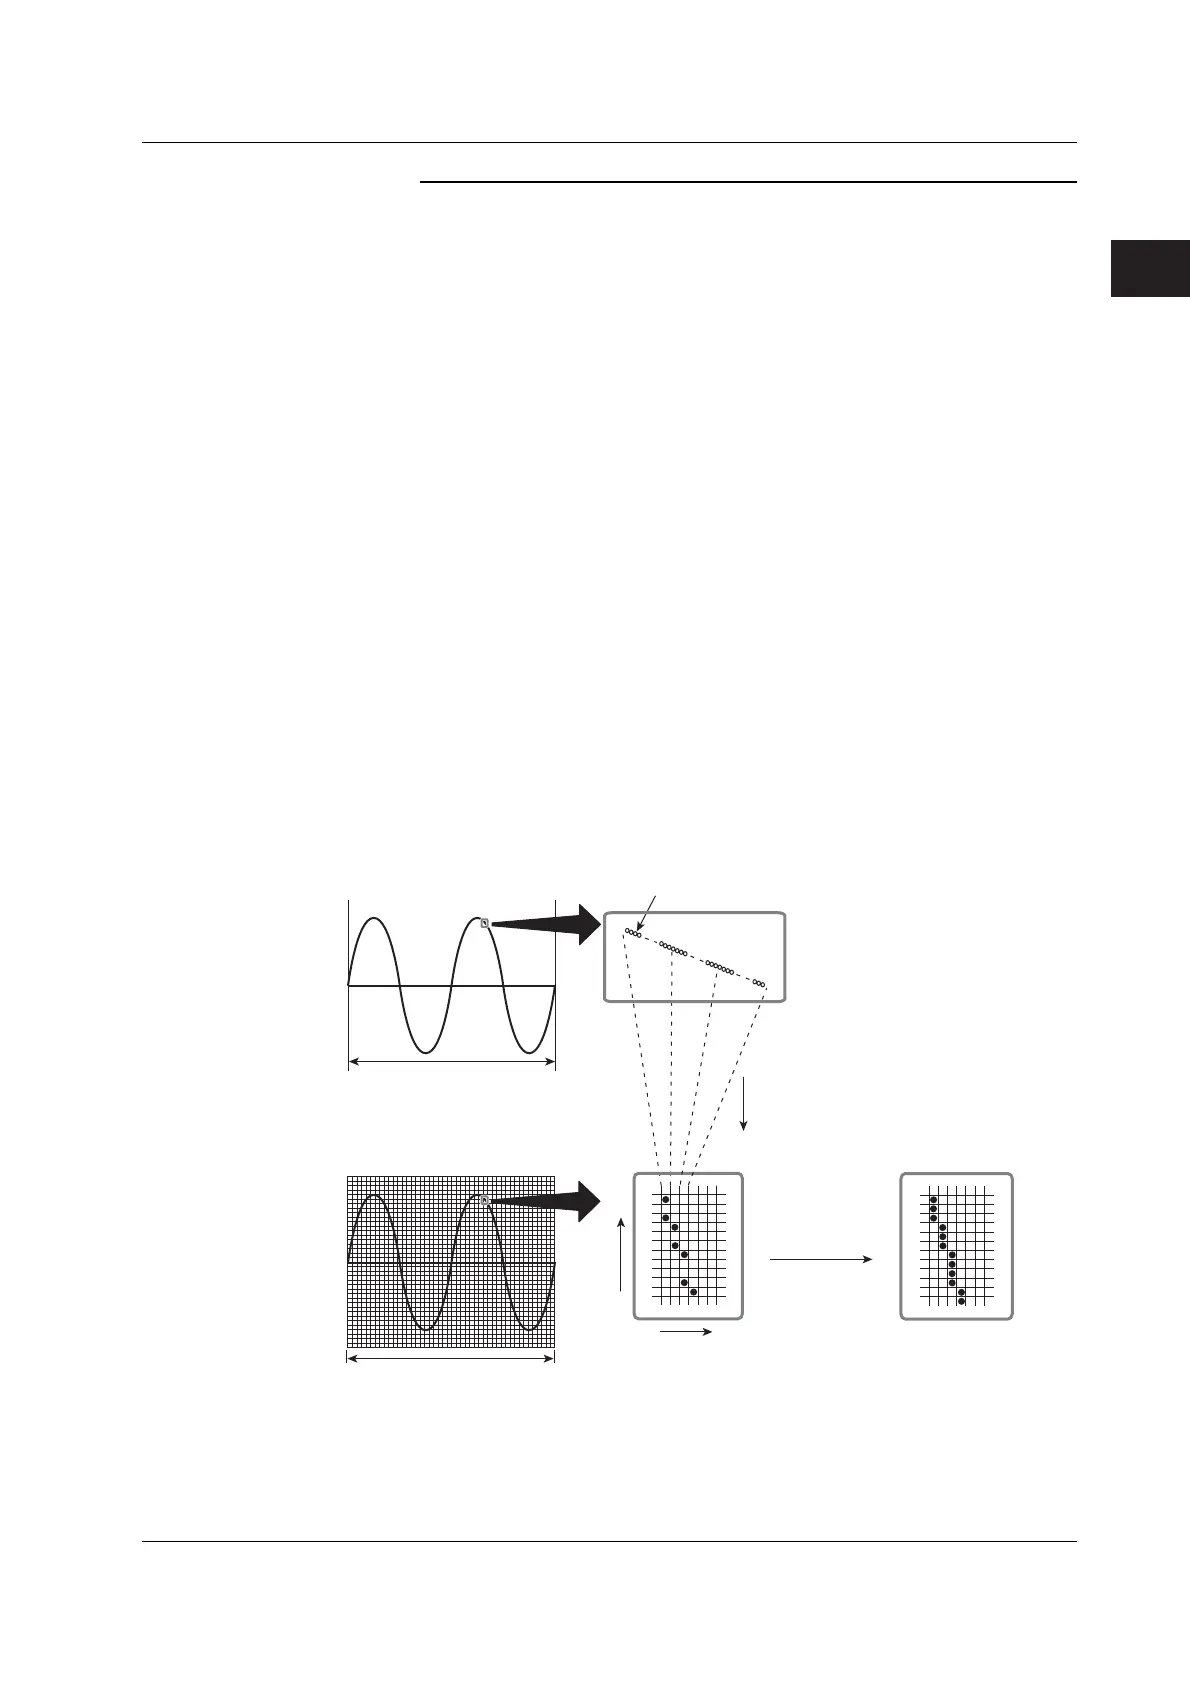
Extraction of the waveform display data from the waveform sampling data (p-p
compression)
Let us consider an example when a 2-Hz sine wave is measured at the data update rate of 1
s. To display this waveform on the WT screen, the number of data points is converted from
approximately 200,000 to 1002 (501 pairs of maximum and minimum values). Thus, two
points (a pair) of waveform display data is derived from approximately 400 points of waveform
sampling data. This conversion is called p-p (peak-peak) compression. The compression rate
of p-p compression varies depending on the data update rate and the horizontal scale (time
axis) of the WT waveform display.
501 rasters
Number of data points:
1,002 (501 pairs)
0
500
Time axis
Vertical axis
Waveform sampling data
Waveform display data (WT screen)
p-p compression
Compresses approximately 400 points of
waveform sampling data to 2 points
(Extracts the maximum and minimum
values and draws them in each raster)
A/D-converted data
1 s
Number of data points:
Approx. 200,000
Turn display
interpolation ON
2.7 Waveform Display
 Loading...