12-4
IM WT5000-02EN
Setting the Graph Display Type (Graph)
4.
Tap Graph to select Trend.
Note
For instructions on how to display the waveforms, see sections 6.1 and 6.3.
Displaying the Cursors (Cursors)
5.
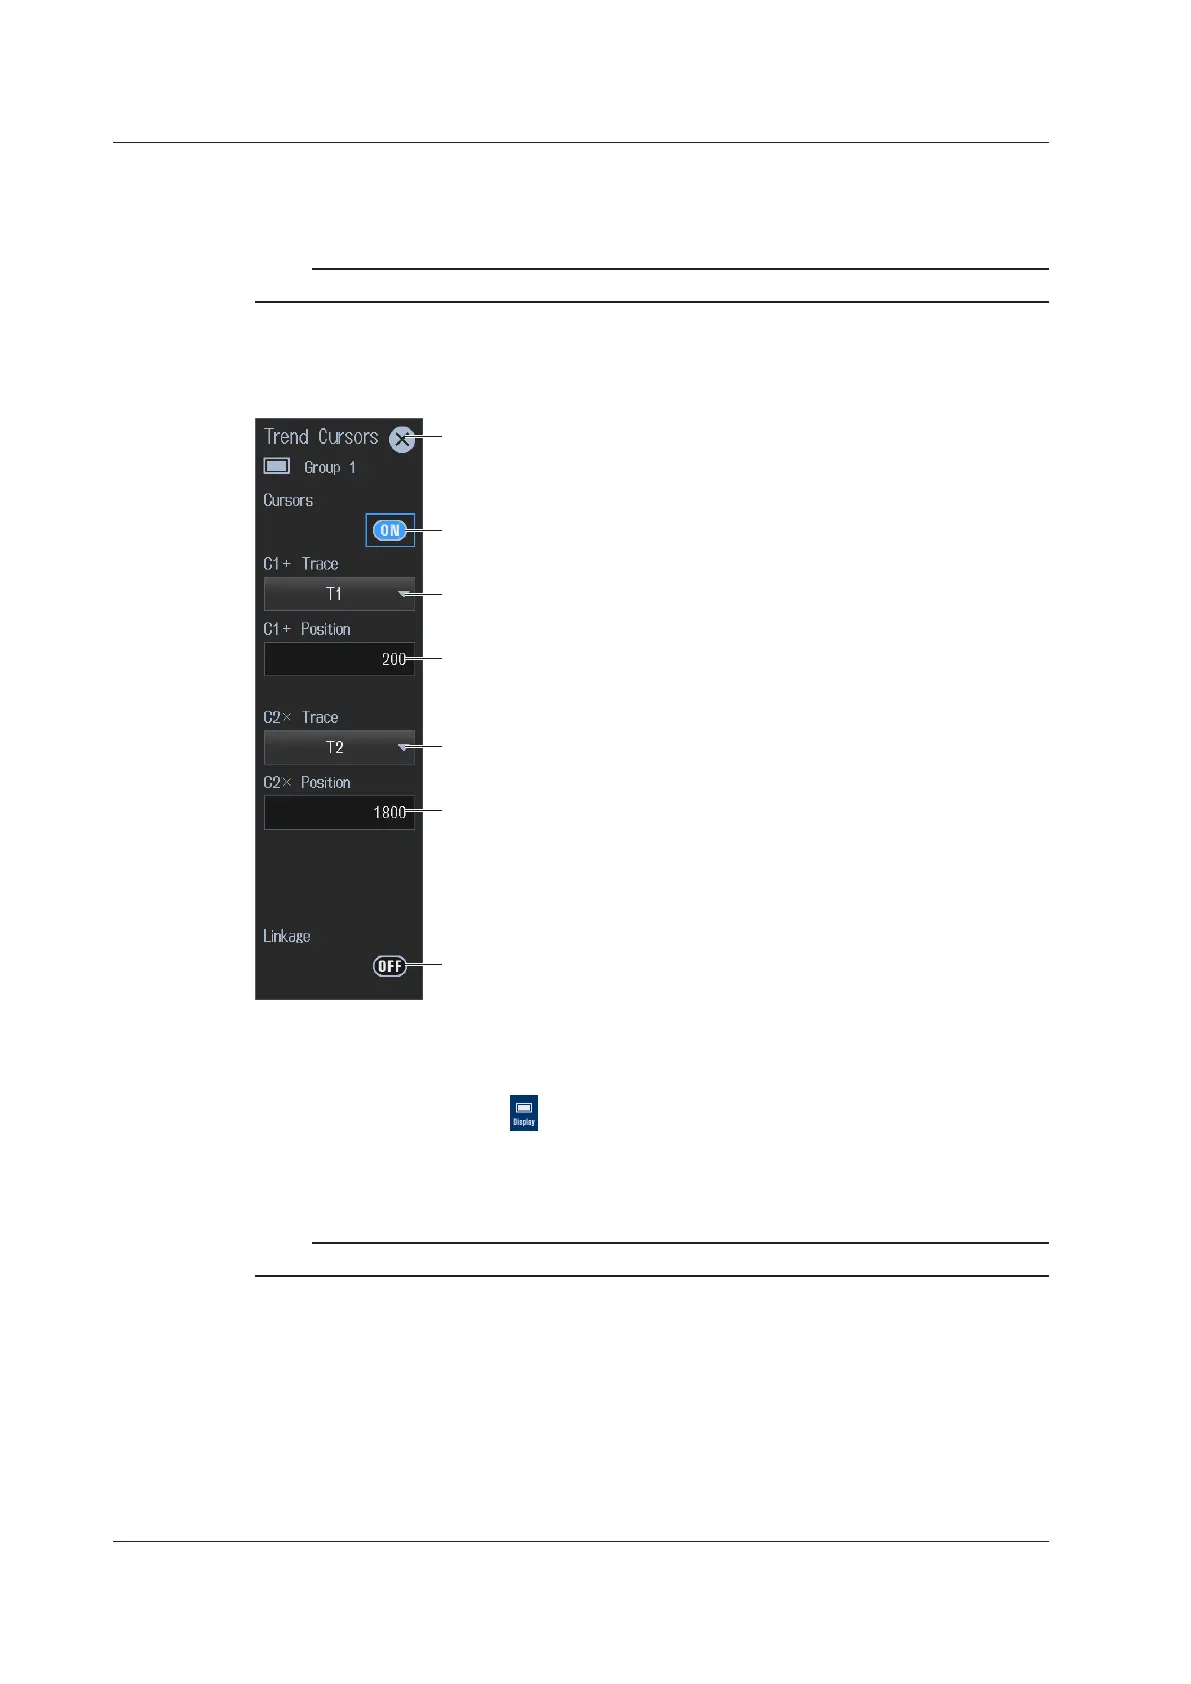
Tap Cursors. A Trend Cursors screen appears.
Closes the menu
Cursor display (OFF, ON)
Set the trend to measure with cursor 1 (+) (T1 to T16).
Set the trend to measure with cursor 2 (×) (T1 to T16).
Set the cursor 1 (+) position (0, which is the left edge of the screen to 2001,
which is the right edge of the screen)
Set the cursor 2 (×) position (0, which is the left edge of the screen to 2001,
which is the right edge of the screen)
Cursor movement linking (OFF, ON)
Procedure Using the Menu Icons
You can also use the menu icons shown on the right side of the screen to switch the displayed items.
1.
Tap the Display menu icon . A Display menu appears in the sub menu area on the right side
of the screen.
By tapping the displayed items, you can specify the same operation as explained in “Switching the
Displayed Items” described earlier.
Note
For details on the Display menu, see page iv.
12.2 Cursor Measurement on Trends
 Loading...