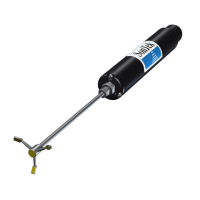
Do you have a question about the YSI SonTek ADVField and is the answer not in the manual?
Measurement Principle | Acoustic Doppler Velocimetry |
---|---|
Velocity Resolution | 0.0001 m/s |
Number of Beams | 3 |
Operating Frequency | 10 MHz |
Operating Temperature | -5°C to 45°C |
Storage Temperature | -20°C to 60°C |
Communication Interface | RS-232 |
Sampling Rate | 1 Hz to 25 Hz |
Beam Angle | 25° |
Data Storage | Internal memory |
Instructions for installing DOS and Windows software on a computer.
Procedures for setting up and performing autonomous data collection.
Running diagnostic software (ADFCHECK) to check system performance.
Details the one-year limited warranty, exclusions, and return procedures.
Explains the function of the signal processing hardware in ADV systems.
Details the 16-MHz MicroADV and 10-MHz ADV probes, their similarities, and configurations.
Defines terms commonly used in the SonTek ADV manual.
Explains ADV sampling strategies for real-time and autonomous data collection.
Instructions for installing DOS and Windows software on a computer.
Reviews operational considerations and system setup before data collection.
Details the setup for real-time data collection using the ADVField system.
Guides through operating the ADVField using the ADF.EXE data acquisition software.
Explains how to calculate power and memory requirements for autonomous deployment.
Explains how to control the ADVField using a terminal emulator.
Describes the four operational modes: command, data acquisition, deployment, and sleep.
Describes the mode for real-time data collection.
Describes the mode for autonomous data collection.
Explains how to enter sleep mode to conserve power.
Summarizes all available commands and their functions.
Lists and describes system commands for general ADVField operation.
Starts real-time data collection and saves parameters.
Starts autonomous data collection using stored parameters.
Sets the maximum velocity range based on experimental needs.
Sets the sampling rate for data output and recording.
Sets the coordinate system for velocity data display and recording.
Sets the deployment file name for data storage.
Sets the time between successive bursts for each burst type.
Tells ADV whether to record amplitude and correlation data.
Tells ADV whether to record compass/tilt sensor data.
Tells ADV whether to record temperature and/or pressure sensor data.
Tells ADV whether to record statistics at the end of each burst.
Tells ADV whether to record data from an optional external pressure sensor.
Tells ADV whether to record data from an optional CTD sensor.
Erases all data from the recorder.
Commands for internal temperature, pressure, and battery voltage sensors.
Common commands for controlling all external sensors.
Commands for external pressure sensors.
Commands for controlling an external LISST-100 sensor.
Performs compass/tilt sensor calibration.
Displays current ADVField hardware configuration.
Displays current real-time data collection parameters.
Terminates data collection and returns to command mode.
Describes the layout and function of the ADVField processing module boards.
Details the layout and features of the CPU board.
Describes switches on the Analog board for probe orientation and sensor selection.
Describes jumpers for selecting serial communication protocols.
Details connectors on the splash-proof housing.
Details connectors on the underwater canister.
Steps to open and disassemble the splash-proof housing.
Provides instructions for changing batteries in the round underwater canister.
Steps to test and replace the input power fuse.
Simple procedure to verify basic compass operation.
Details compass installation and mounting for correct orientation.
Describes how to calibrate the compass to compensate for magnetic distortion.
Details the PAROS sensor, its characteristics, and limitations.
Describes the DRUCK RPT sensor, its features, and requirements.
Describes the PAROSFREQ sensor, its features, and requirements.
Instructions for loading the HYDRA.TTB program into the LISST-100.
Configures the ADVField/Hydra for data collection with the LISST sensor.
Explains the XYZ and ENU coordinate systems for velocity data.
Describes supported serial communication protocols (RS232, RS422, RS485).
Explains how to operate multiple ADV systems simultaneously using RS485.
Discusses analog output voltages and their conversion to velocity data.
Explains how to synchronize ADV data collection using SyncIn/SyncOut signals.
Provides advice on mounting and handling the ADV sensor.
Lists various optional integrated sensors available.
Discusses the need for seeding material in certain water conditions.
Provides recommendations for anti-fouling paint and protection.
Offers general guidelines for ADV maintenance and care.
Provides guidance for diagnosing common ADV problems.
Troubleshoots common issues related to setup and serial communication.
Recommends using ADFCHECK for hardware diagnostics.
Discusses causes and solutions for excessive noise in velocity data.
Addresses low SNR issues affecting velocity measurements.
Discusses low correlation values and their impact on data quality.
Details the real-time ASCII output format over the serial port.
Describes the real-time binary output format over the serial port.
Details the ASCII output format sent over the serial port during autonomous collection.
Describes the binary output format to the internal recorder.
Explains how deployment files are created and named.
Describes the structure of data blocks in autonomous files.
Defines the structure of data blocks in C language code.
Explains RS485 protocol for multi-system control.
Details how to set the system address for RS485 communication.
Guides on using SonTerm for RS485 communication.
Introduces the SonUtils main menu and its programs.
Describes the Terminal emulator for direct communication.
Guides on opening Hydra data files and selecting loading options.
Explains the ViewHydra display elements and graphs.
Describes the burst data time-series graph.
Explains the burst information dialog box with tabular data.
Details options in the View Menu for customizing the display.
Explains options for processing burst statistics and display data.
Displays configuration information recorded during data collection.
Allows viewing data in various formats (histograms, spectra, scatter diagrams).