SonTek/YSI
Acoustic Doppler Velocimeter Principles of Operation (September 1, 2001)
5
6. ADV Data
The ADV records nine values with each sample: three velocity values (one for each component),
three signal strength values (one for each receiver), and three correlation values (one for each re-
ceiver). Naturally, the velocity data are of foremost interest. Concerns relating to the use of the
velocity data are discussed in §6.1. Signal strength and correlation are used to monitor data qual-
ity and to edit potentially corrupted data, which are discussed in §6.2 and §6.3, respectively.
6.1. Velocity
ADV velocity data can be output in Cartesian coordinates (XYZ) relative to probe orientation or
in Earth coordinates (East-North-Up or ENU) for systems with the optional compass. In general,
the velocity data output by the ADV can be used directly without postprocessing. The ADV cali-
bration does not change unless the probe has been physically damaged. The only time post-
processing corrections are required is when sound speed has been incorrectly specified (§7.2).
Several aspects of ADV operation affect the quality of velocity data. Most important of these is
the velocity range setting (discussed in §6.1.1). ADV sampling rate, accuracy of velocity data,
and instrument-generated noise are discussed in sections 6.1.2 through 6.1.4.
6.1.1. Velocity Range
One of the most important ADV parameters is the velocity range setting. This determines the
maximum velocity that can be measured by the instrument. Standard velocity range settings for
the 16/10-MHz ADVs are ±3, ±10, ±30, ±100, and ±250 cm/s; for the 5-MHz ADVOcean, the
standard velocity range settings are ±5, ±20, ±50, ±200, and ±500 cm/s. In general, you should
select the lowest velocity range setting that will cover the maximum velocity expected in a given
experiment. As will be discussed in §6.1.4, the instrument-generated noise in velocity data is
proportional to the velocity range setting; higher velocity ranges have higher noise levels.
The velocity range settings are nominal values; the true maximum velocity depends on the direc-
tion of flow relative to the probe. The ADV measures velocities along the bistatic axis of each
receiver; the maximum velocity limitations are for bistatic velocities. Since the bistatic axes are
15° off the probe vertical axis, the ADV is more sensitive to vertical flow, and has a lower maxi-
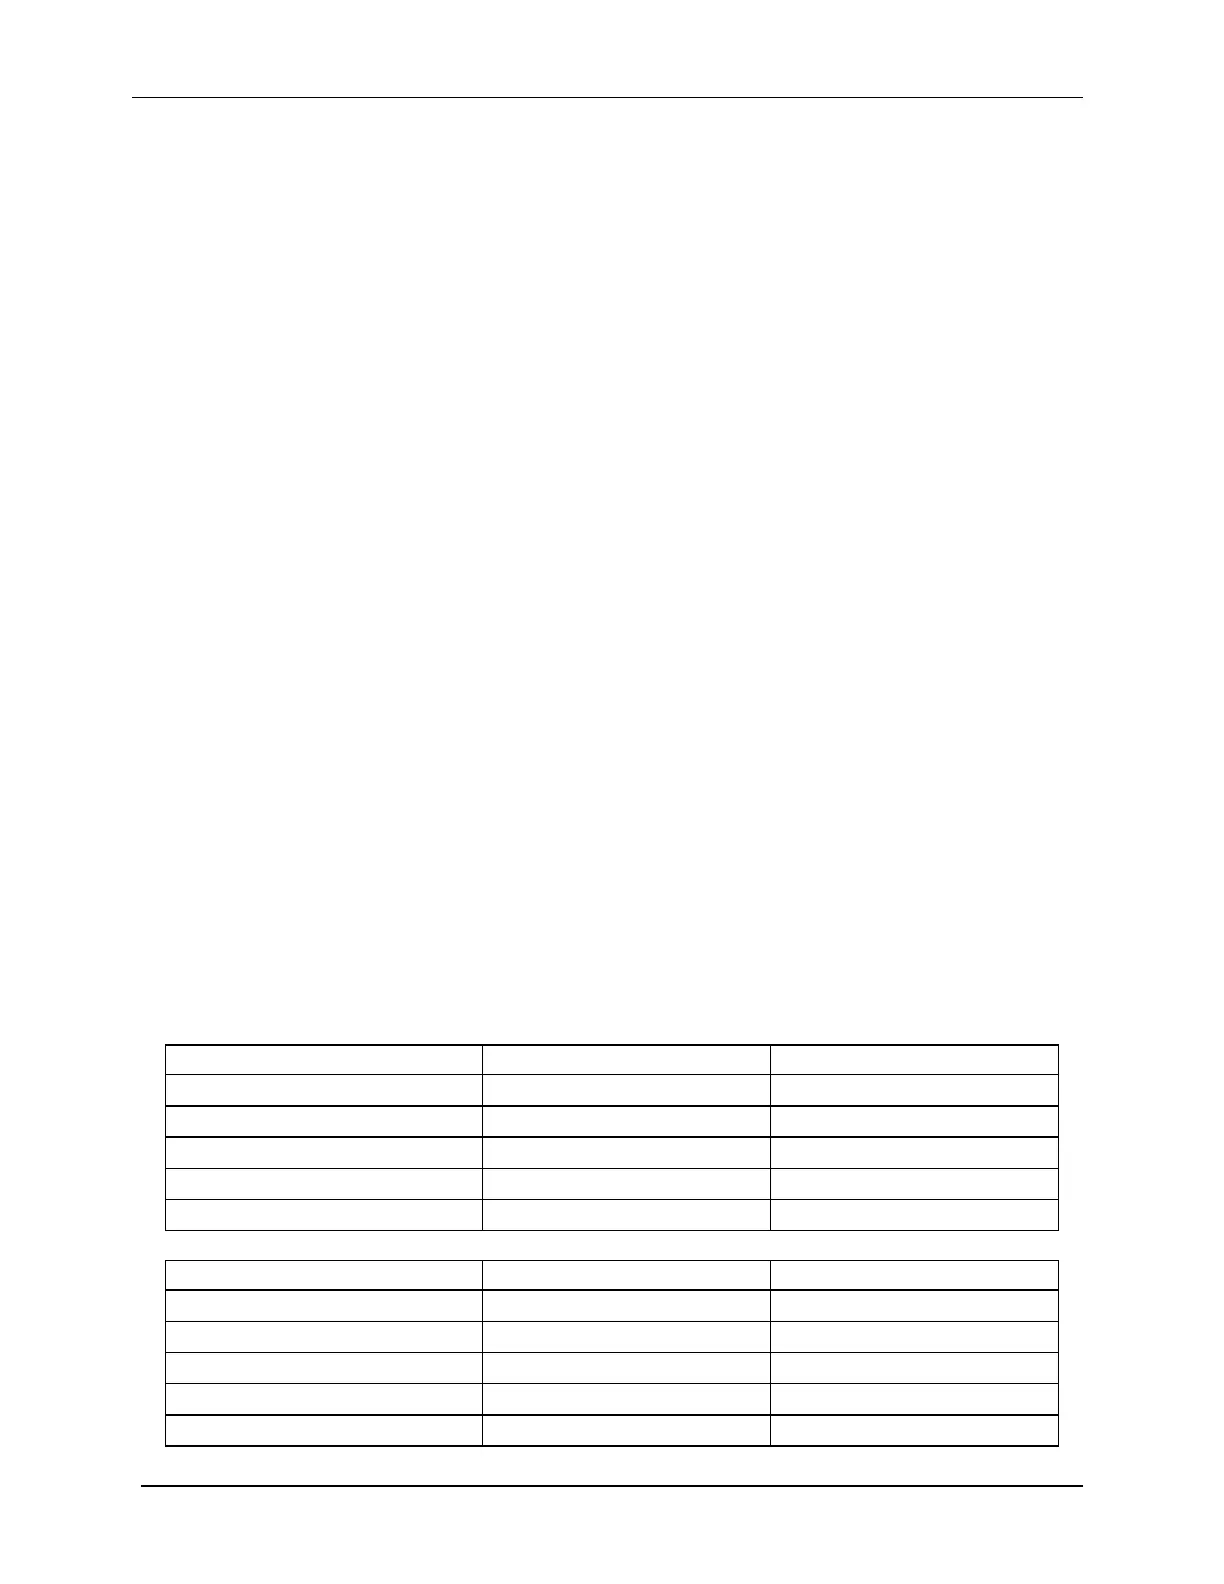
mum velocity for vertical flow. The tables below shows the maximum velocities that can be
measured in each ADV velocity ranges for purely vertical or purely horizontal flow.
ADV Velocity Range Max. Horizontal Velocity Max. Vertical Velocity
±3 cm/s ±30 cm/s ±8 cm/s
±10 cm/s ±60 cm/s ±15 cm/s
±30 cm/s ±120 cm/s ±30 cm/s
±100 cm/s ±300 cm/s ±75 cm/s
±250 cm/s ±360 cm/s ±90 cm/s
ADVOcean Velocity Range Max. Horizontal Velocity Max. Vertical Velocity
±5 cm/s ±30 cm/s ±8 cm/s
±20 cm/s ±40 cm/s ±10 cm/s
±50 cm/s ±80 cm/s ±20 cm/s
±200 cm/s ±300 cm/s ±75 cm/s
±500 cm/s ±500 cm/s ±120 cm/s
 Loading...