1- 41
Making Measurements
Using Markers
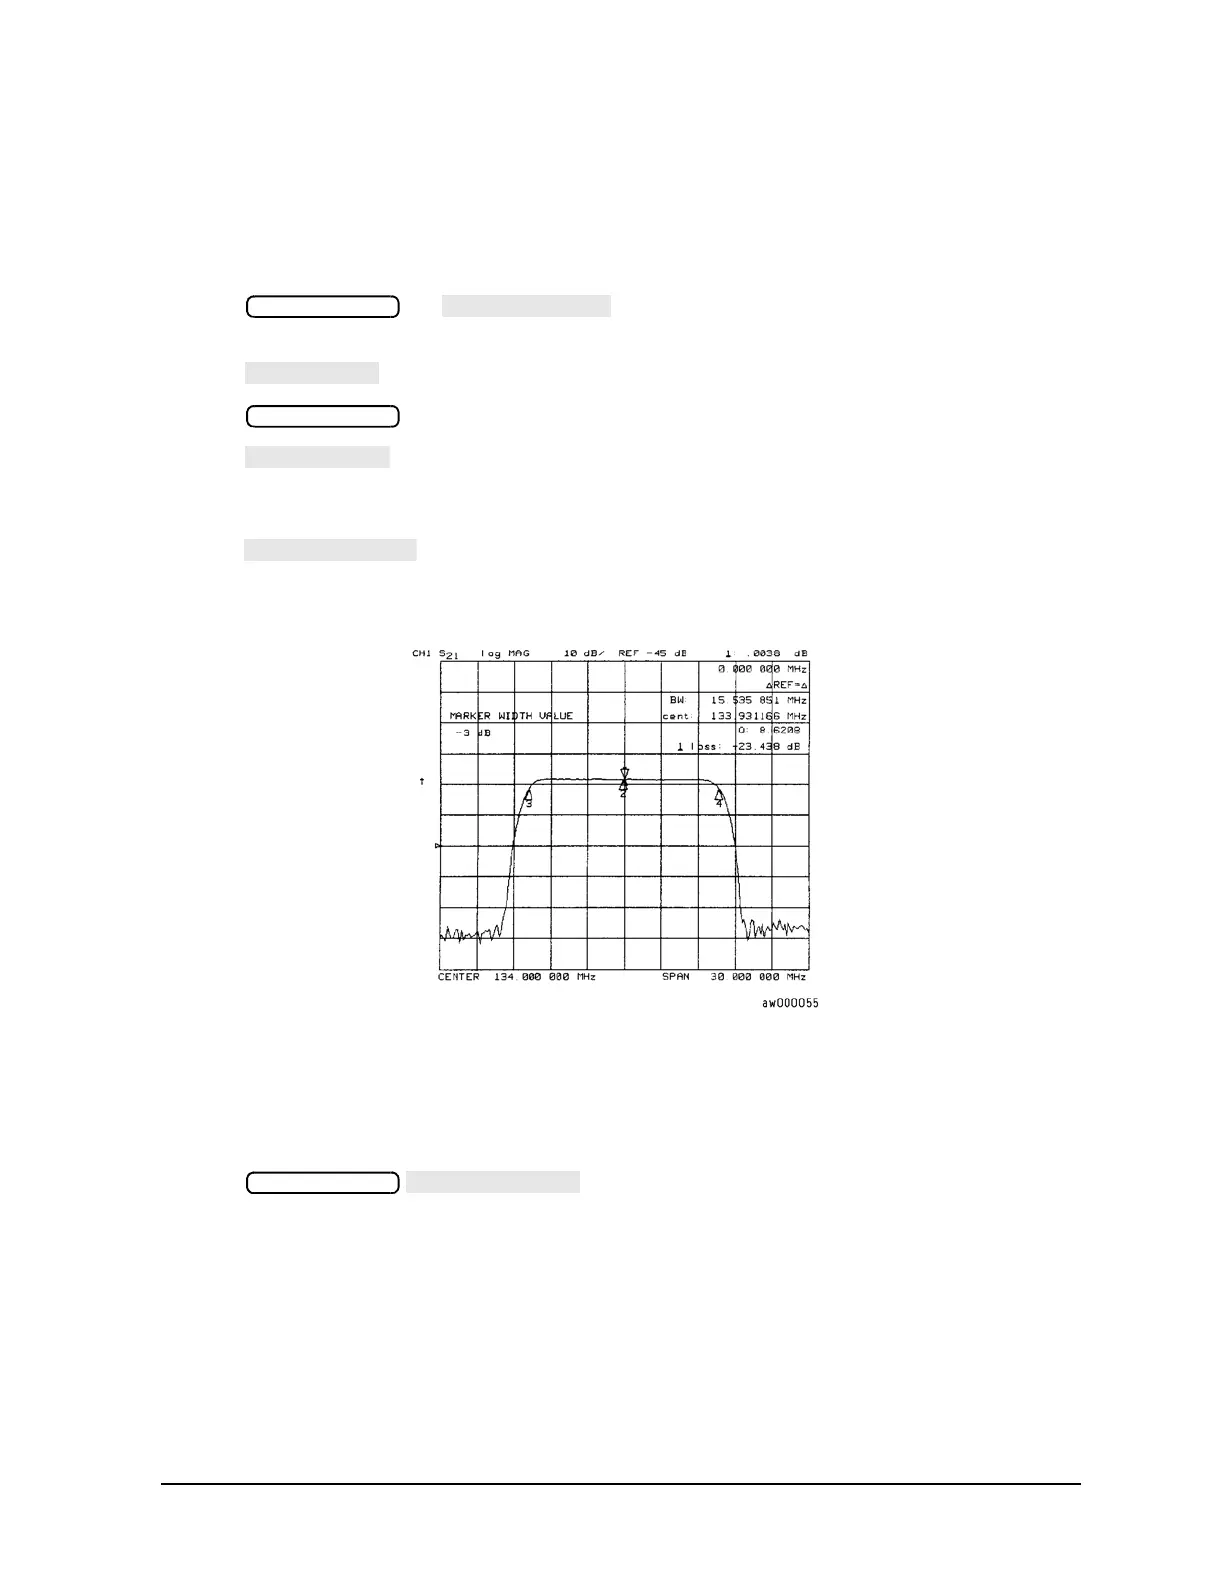
Searching for a Bandwidth
The analyzer can automatically calculate and display the bandwidth (BW:), center frequency (CENT:), Q, and
loss of the device under test at the center frequency. (Q stands for “quality factor,” defined as the ratio of a
circuit's resonant frequency to its bandwidth.) These values are shown in the marker data readout.
1. Press and to place the marker near the center of the filter
passband.
2. Press if you want the bandwidth relative to the maximum.
3. Press to access the marker search menu.
4. Press to calculate the center stimulus value, bandwidth, and the Q of a bandpass or
band reject shape on the measurement trace.
5. If you want to change the amplitude value (default is 3 dB) that defines the passband or reject band,
press
and enter the new value from the front panel keypad.
Figure 1-31 Example of Searching for a Bandwidth Using Markers
Tracking the Amplitude that You Are Searching
1. Set up an amplitude search by following one of the previous procedures in "To Search for a Specific
Amplitude" on page 1-39.
2. Press to track the specified amplitude search with every new
trace and put the active marker on that point.
When tracking is not activated, the analyzer finds the specified amplitude on the current sweep and the
marker remains at same stimulus value, regardless of changes in the trace response value with
subsequent sweeps.
To Calculate the Statistics of the Measurement Data
This function calculates the mean, standard deviation, and peak-to-peak values of the section of the
displayed trace between the active marker and the delta reference. If there is no delta reference, the