1-8
Making Measurements
Measuring Magnitude and Insertion Phase Response
4. Reconnect your test device.
5. To better view the measurement trace, press:
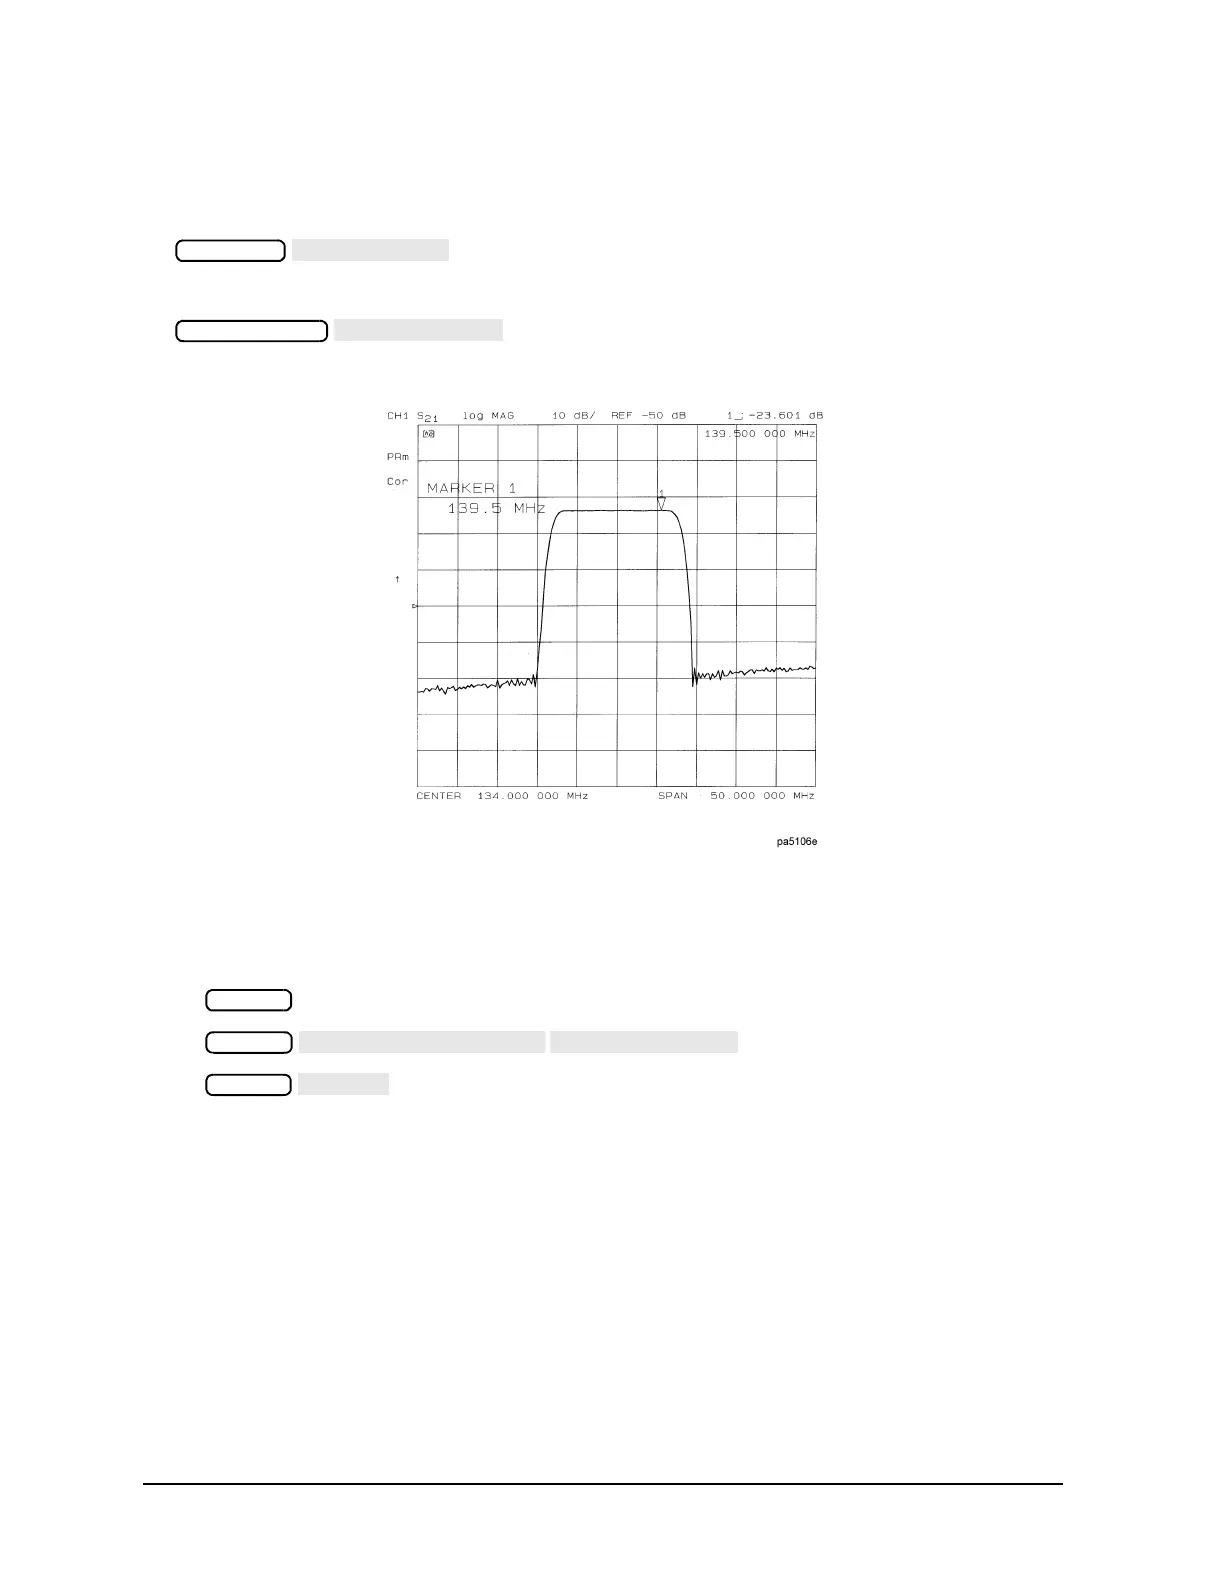
6. To locate the maximum amplitude of the device response, as shown in Figure 1-3, press:
Figure 1-3 Example Magnitude Response Measurement Results
Measuring Insertion Phase Response
7. To view both the magnitude and phase response of the device, as shown in Figure 1-4, press:
The channel 2 portion of Figure 1-4 shows the insertion phase response of the device under test. The
analyzer measures and displays phase over the range of 180 to +180. As phase changes beyond these
values, a sharp 360 transition occurs in the displayed data.