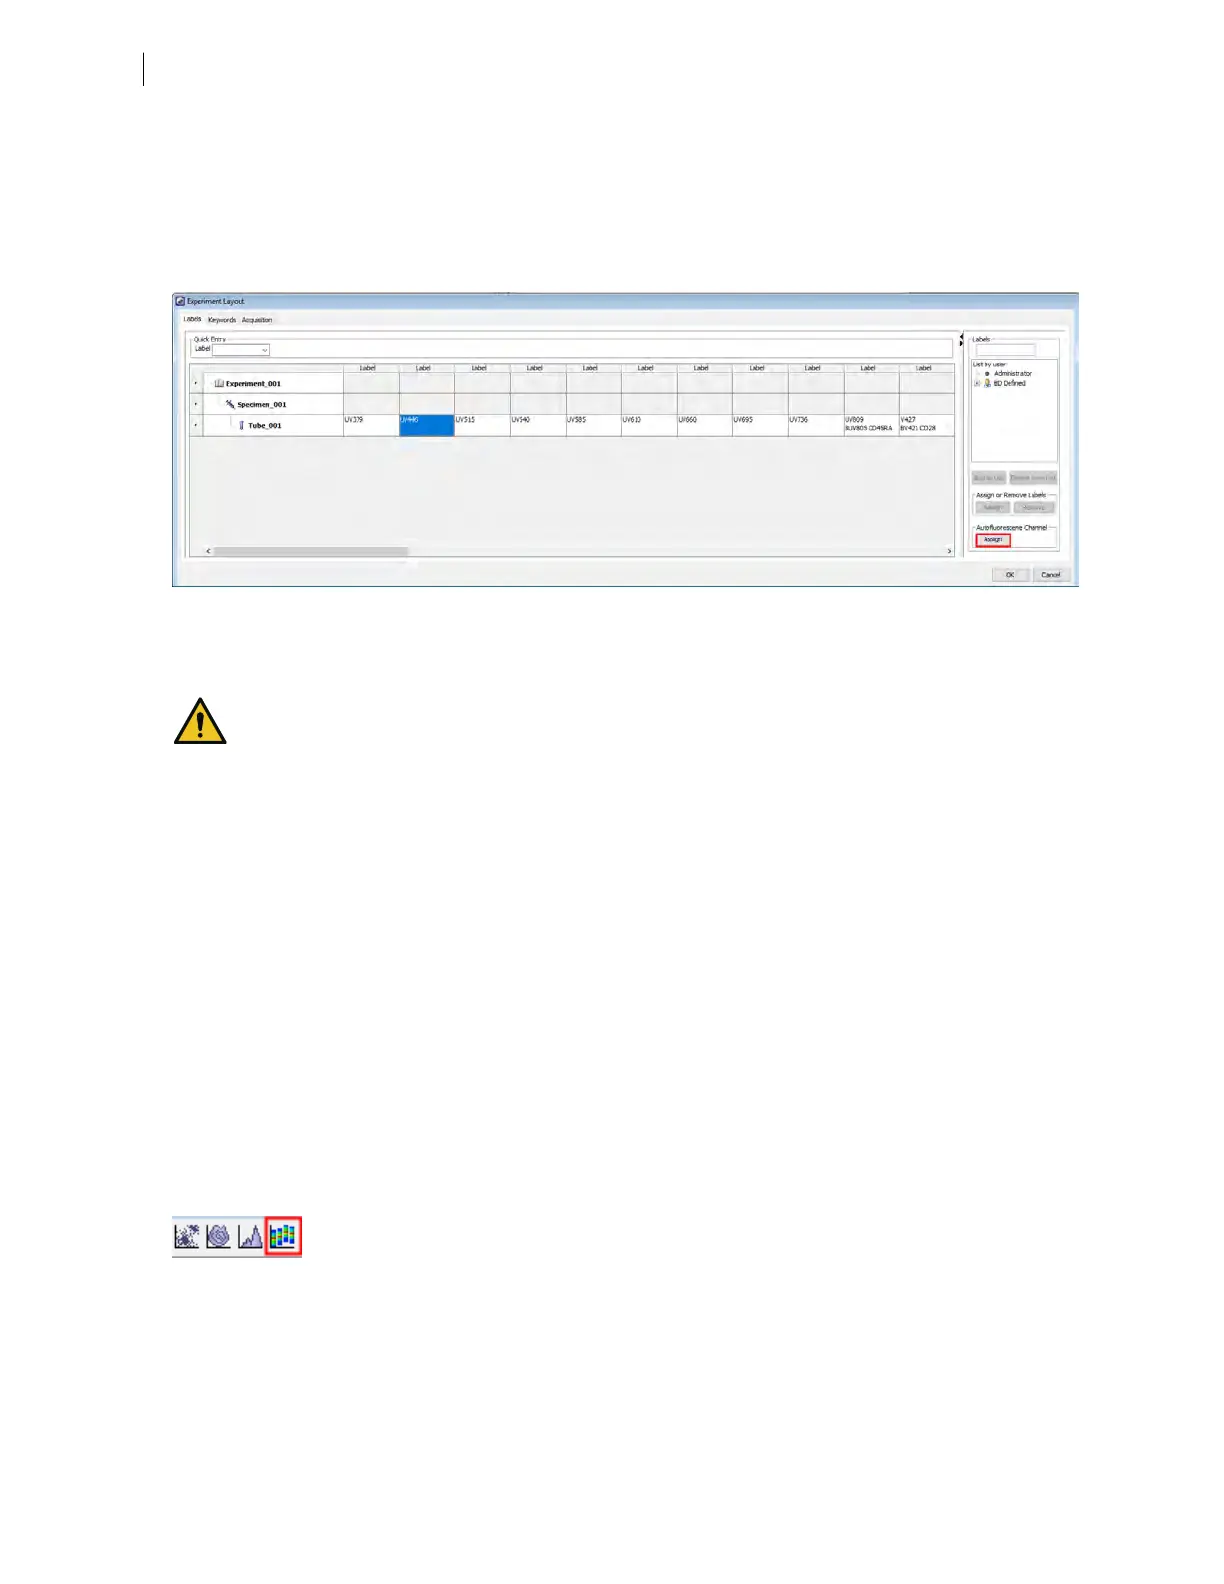
4. Navigate to Experiment >Experiment Layout and assign parameter labels for each reagent to an
individual primary detector. Typically, both the dye and the antibody names are added to the label, as
shown in the following example. To add an autofluorescence control to your experiment, select a paramater
label associated with a channel with high autofluorescence, typically one of the lower wavelengths of the
UVor Violet laser. Click the Assign button in the Autofluorescence Channel section of the Labels panel to
add AutoF to the selected parameter label.
Note: The "AutoF"label is case-sensitive. The Autofluorescence control is only supported in spectral
workflows, not compensation workflows. Calculate Compensation cannot be performed if an AutoF label is
assigned.
AutoF should only be assigned to a single channel within an experiment setup. Calculate Spectral
Unmixing cannot be performed if more than one channel has AutoF assigned.
5. Adjust the flow cytometer settings as needed for your experiment, including PMT voltage and area scaling.
Note: For spectral experiments, create a spectral plot to assist with adjusting PMTvoltage settings. Using a
spectral plot lets you ensure that the signal across all detectors is on-scale, not just the signal for the primary
detector for each fluorochrome. For details about spectral plots, see the note at the end of this procedure.
l
For details about adjusting PMT voltage settings for the unstained sample and single-color control tubes,
see Creating application settings (page 77).
l
For details about adjusting area scaling, see Adjusting area scaling (page 97).
6. Set the Current Tube Pointer to the previously created sample tube with labeled parameters.
7. Create any plots, gates, and statistics needed for data analysis. For details, refer to the BDFACSDiva™
Software Reference Manual.
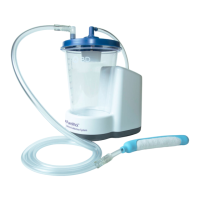
Note: In addition to the dot and density plots, contour plots, and histogram plots for single-parameter data
used in compensation cytometry, the BDFACSymphony™A5SE flow cytometer features the ability to
create spectral plots, where the plot shows combined color-coded histograms of all raw detector values. The
icon on the worksheet toolbar for creating a spectral plot is outlined in red in the following illustration:
58 BD FACSymphony™ A5 SE User's Guide