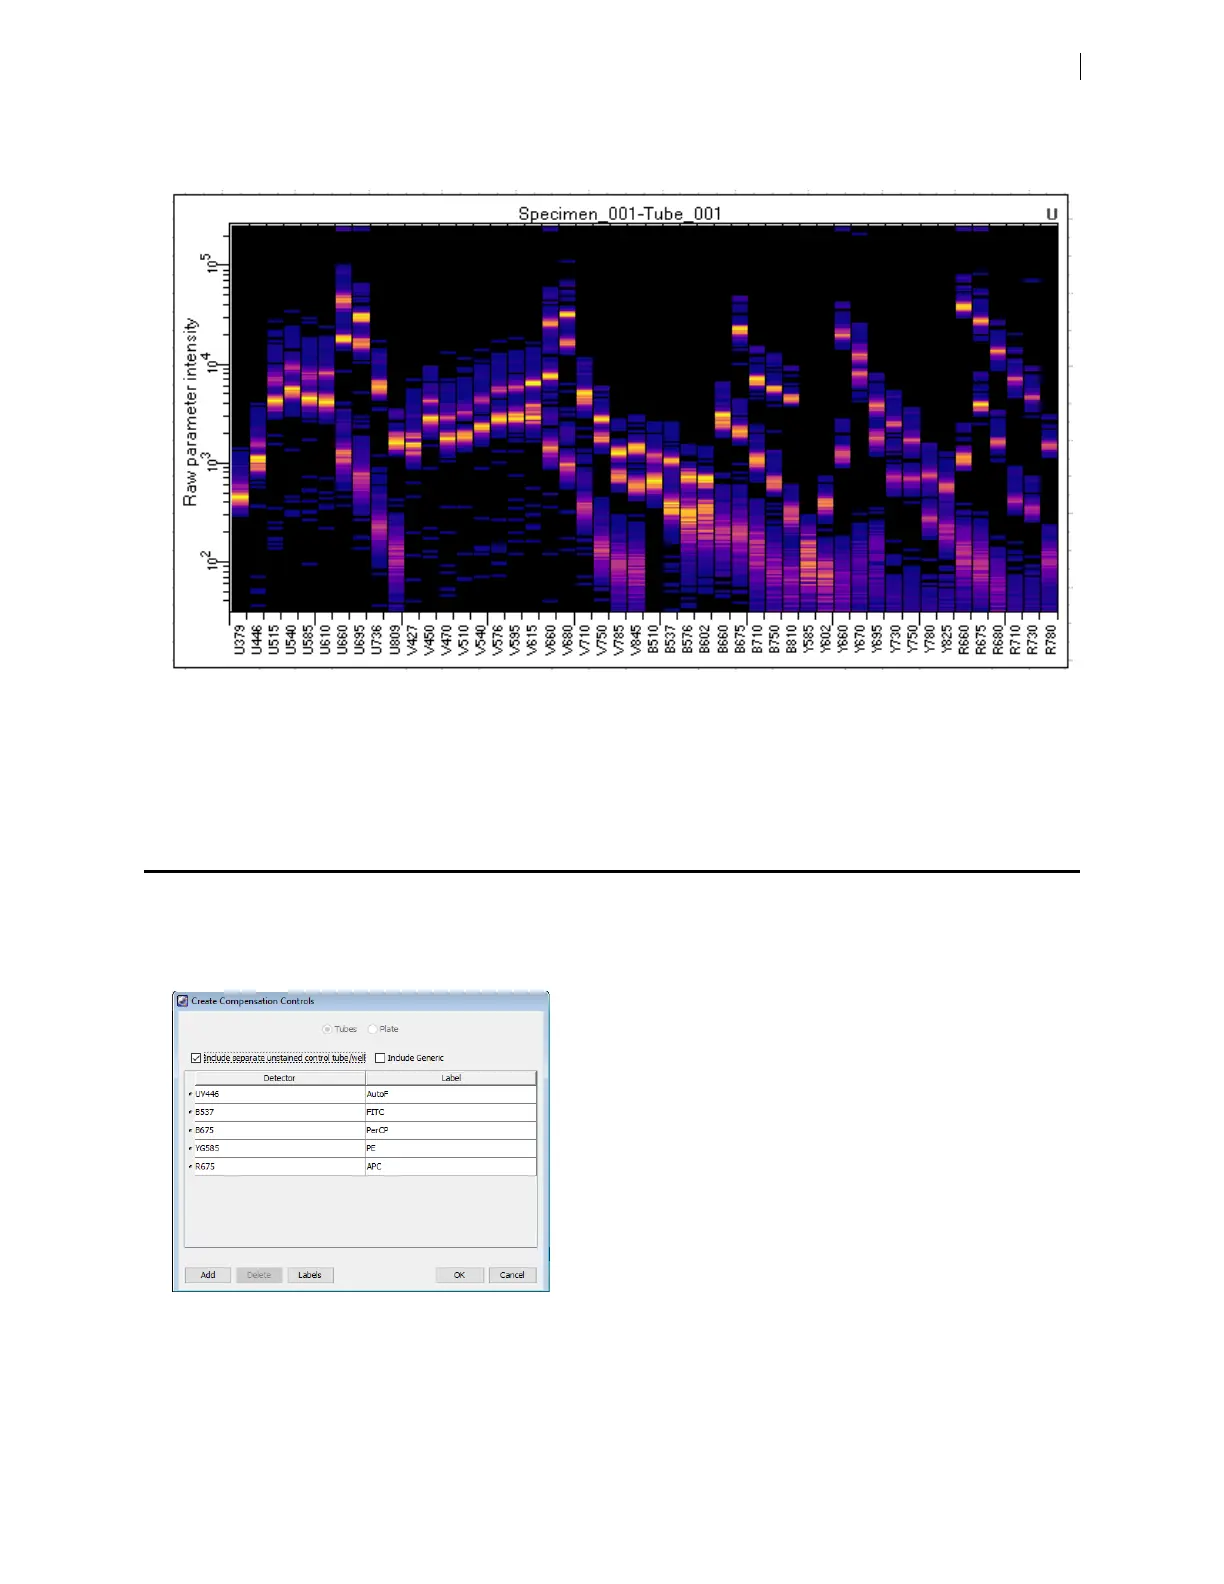
The detector names displayed along the x-axis are formed by combining the first character of the laser color
with the center value of the filter bandpass range for that detector.
The plot supports the display of specific populations or combinations of populations, and displays live data
during acquisition. Density color schemes or color by population can be modified in the inspector window
when the plot is selected.
The spectral plot does not support zoom, biexponential scaling, or gate drawing.
Creating a Spectral Unmixing matrix
Before performing the following procedure, make sure that you have set up the PMT voltages as described in
Creating application settings (page 77).
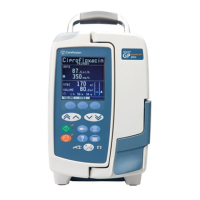
1. Select Experiment >Compensation Setup >Create Compensation Controls from the main menu.
2. Leave the checkbox Include Generic in its default (deselected)state.
Chapter 5 Spectral functions 59