Spectral function overview
Spectral flow cytometry represents an alternative measurement strategy to compensation flow cytometry. In
both cases, surface markers or intracellular analytes on single cells are quantified by measuring antigen-specific
fluorescent labels with varying spectral properties.
Compensation flow cytometry follows a paradigm of one detector per label in which the intensity of light
emitted from the different labels is measured using label-specific photodetectors. The resulting data is
subsequently transformed through a process called “compensation” to correct for the effects of spectral overlap
between different fluorophores. Mirrors and filters that are broad enough to identify the target fluorescent
label but also narrow enough to limit fluorescent spillover direct discrete portions of emitted light from each
fluorescent label to the corresponding detector. This can lead to the omission of portions of spectral
information that, when measured and transformed appropriately, could have aided in discriminating one
fluorescent label from another.
In contrast, spectral cytometry uses a set of photodetectors spanning the visible spectrum—similar to a
traditional spectrometer—to sample the full emission spectrum of all fluorescent labels present on the cell, and
then uses a deconvolution process called spectral unmixing to determine the underlying label abundances. In
spectral cytometry, sampling the full spectrum allows the cytometer to collect all light emitted from fluorescent
labels and distinguish them from others in a multicolor experiment. This can provide advantages in flexibility of
fluorescent label inputs without having to change filters, as well as the ability to multiplex more fluorescent
labels in one multicolor sample.
In both cases, spillover spreading remains the primary limiting factor for panel performance and both spectral
and compensation sampling methods entail many of the same requirements for experimental design and
customer workflow. It is critical in both cases for single-stained reference controls to match the final sample as
closely as possible. However, spectral cytometry can be more sensitive to discrepancies between the
fluorochrome spectra in single-stained controls and the fully stained sample of interest.
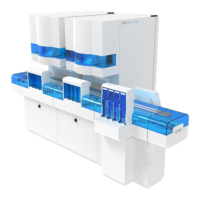
The BDFACSymphony™A5SE is an RUO solution for a high-parameter spectral analyzer. Its spectral
capabilities are enabled by the combination of optimized fixed configurations of lasers, standard filter set, and
detectors. The software for the instrument, BDFACSDiva™ v9.3 or later, supports customer workflows that can
be either spectral or traditional compensation experiments. This section describes the spectral functionality and
workflows.
The BDFACSymphony™A5SE is a 5-laser, 48-fluorescent-channel instrument where each channel is assigned
to a specific laser. The number of channels assigned to each laser is as follows:
l
UVlaser:10 fluorochrome channels
l
Violet laser:14 fluorochrome channels
l
Blue laser:9 flurochrome channels +side-scatter channel (SSC)
l
Yellow-green laser:9 fluorochrome channels
l
Red laser:6 fluorochrome channels
For each laser, each of its channels is routed to a different detector. As can be seen from the following figure,
the only significant gaps in spectral response are near the laser emission wavelengths.
48 BD FACSymphony™ A5 SE User's Guide