4. In the Cytometer window, optimize the PMT voltages for the application.
l
Optimize the FSC and SSC voltages to place the population of interest on scale.
l
Optimize the FSC threshold value to eliminate debris without interfering with the population of interest.
l
If needed, increase the fluorescence PMT voltages to place the negative population within the gray
boxes. Align the center of the negative population with the crosshair visible in the gray box.
Note: Do not decrease the fluorescence PMT voltages. Doing so can make it difficult to resolve dim
populations from the negative population.
5. Unload the unstained control tube from the cytometer.
6. Load the multicolor sample onto the cytometer or load a single-color control tube.
7. Verify that the positive populations are on scale.
If a positive population is off scale, lower the PMT voltage for that parameter until the positive population
can be seen entirely on scale.
8. Unload the multicolor sample or single-color control tube.
9. If working with single-color control tubes, repeat steps 6–8 for every control tube to verify each
fluorochrome signal separately.
10. Place a tube containing DI water on the SIP and put the cytometer on standby.
11. Save the application settings by right-clicking Cytometer settings in the Browser, then selecting Cytometer
Settings > Save.
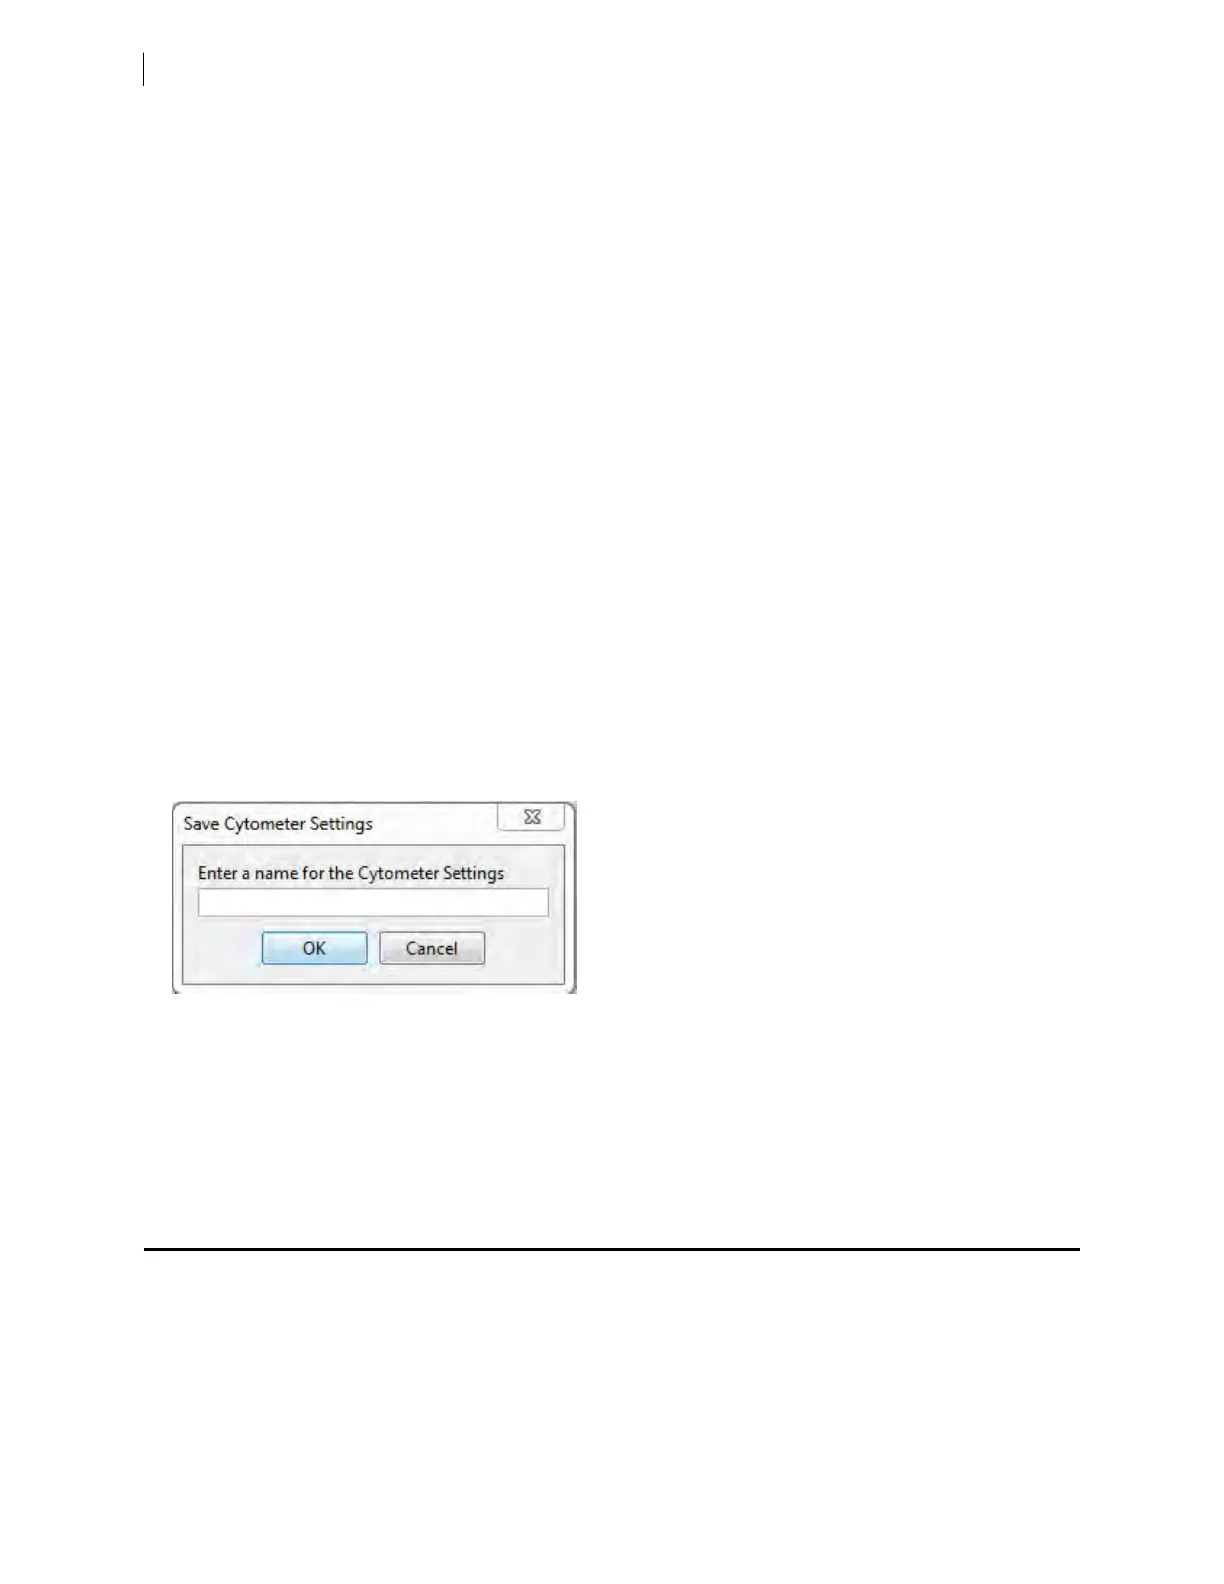
12. In the Save Cytometer Settings dialog, enter a descriptive name for the settings.
13. Click OK.
The application settings are saved to the catalog.
Next step
Recording compensation controls (page 78)
Recording compensation controls
Introduction
This topic describes how to create and record compensation controls using the Compensation Setup feature of
BDFACSDiva™ software and an experiment with optimized settings.
78 BD FACSymphony™ A5 SE User's Guide