Chapter 5: Calcium Flux 93
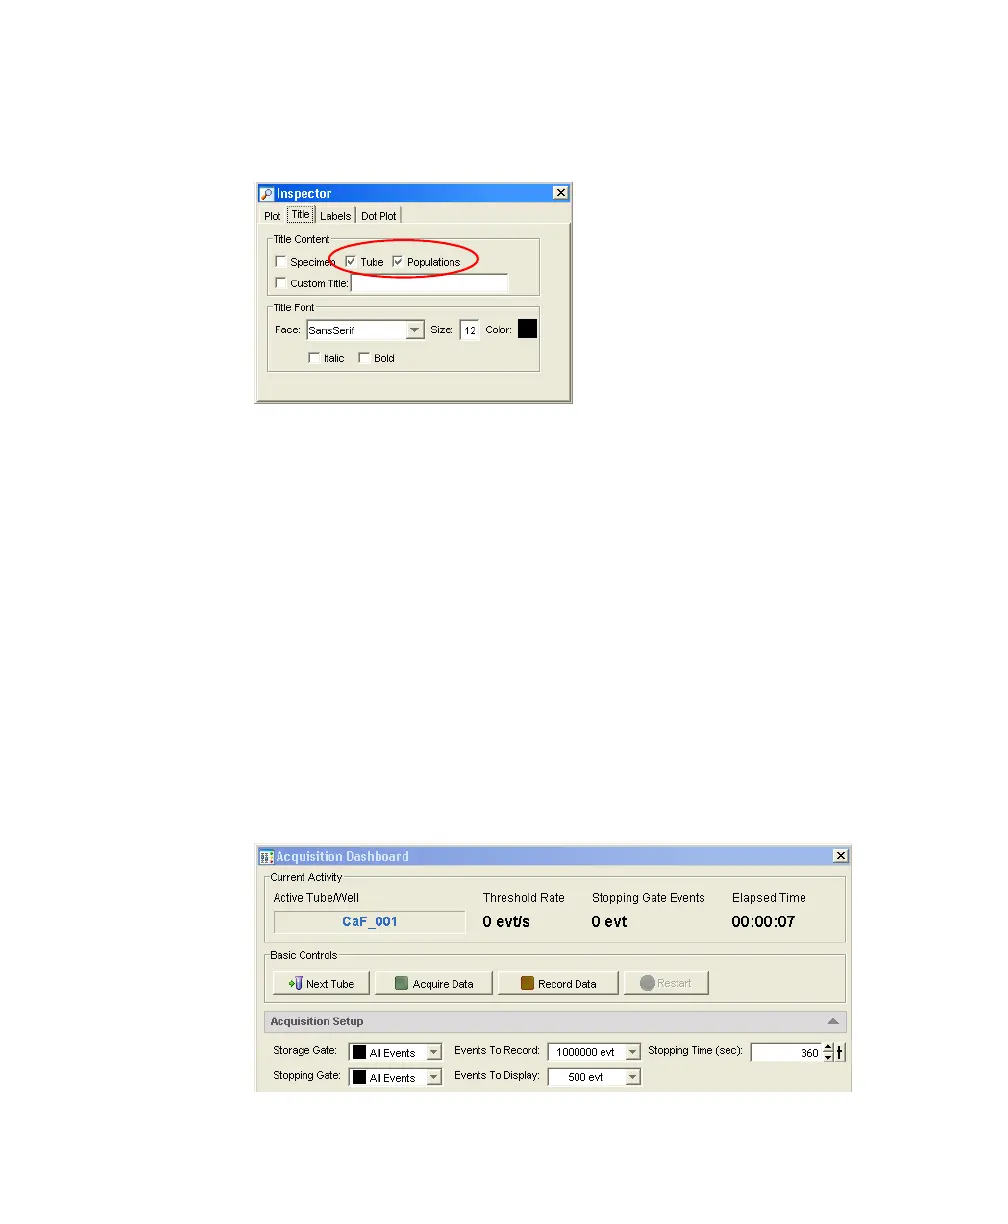
9 Select all plots. Click the Title tab in the Inspector and select the Tubes and
Populations checkboxes to display their names in plot titles.
10 Create a statistics view and display the mean for Indo-1 (Blue)-A, Indo-1
(Violet)-A, and the ratio parameter.
• Choose Populations > Create Statistics View.
• Right-click on the Statistics view and select Edit Statistics View.
• Under the Population tab, deselect #Events and %Parent.
• Under the Statistics tab, select the mean for Indo-1 (Blue)-A, Indo-1
(Violet)-A, and the ratio parameter.
•Click OK.
11 In the Acquisition Dashboard, set the Events To Record to 1,000,000, the
Events To Display to 500, and the Stopping Time to 360 seconds.
LSR2.book Page 93 Tuesday, April 25, 2006 3:34 PM