Chapter 3: Running Samples 67
5 On the MyData worksheet, create some plots for previewing data:
• FSC vs SSC
•FITC vs PE
•FITC vs PerCP
•FITC vs APC
; Tip Double-click the Dot Plot button to keep the button selected until you
create all plots.
Recording Data
In this section, you preview and record data for multiple samples.
1 Install the first sample tube on the cytometer.
2 Move the current tube pointer to Beads_001.
3 Click Acquire Data in the Acquisition Dashboard to begin acquisition.
4 While data is being acquired:
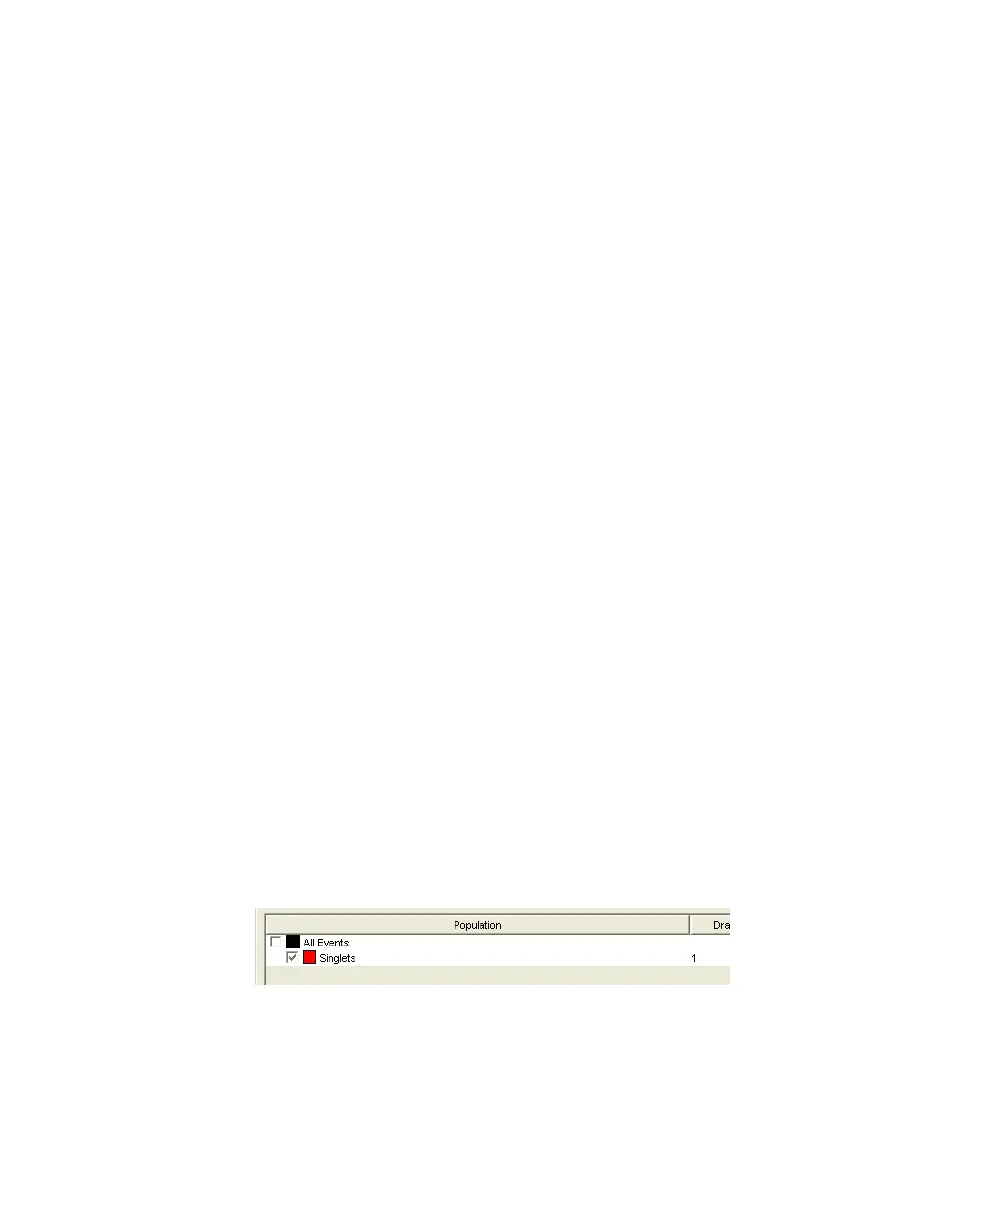
• Draw a gate around the singlets on the FCS vs SSC plot.
• Rename the P1 gate to Singlets.
• Use the Inspector to set the other plots to show only the singlet
population.
5 Click Record Data.
LSR2.book Page 67 Tuesday, April 25, 2006 3:34 PM