94 BD LSR II User’s Guide
Only the specified number of Events to Display are shown during
acquisition and recording. After data recording is complete, all recorded
events will be displayed.
Optimizing for Calcium Flux
1 On the control panel, press RUN and LO.
2 Install the sample (not yet stimulated) on the SIP.
3 Verify that the green current tube pointer is in front of the CaF_001 tube in
the Browser. In the Acquisition Dashboard, click Acquire Data.
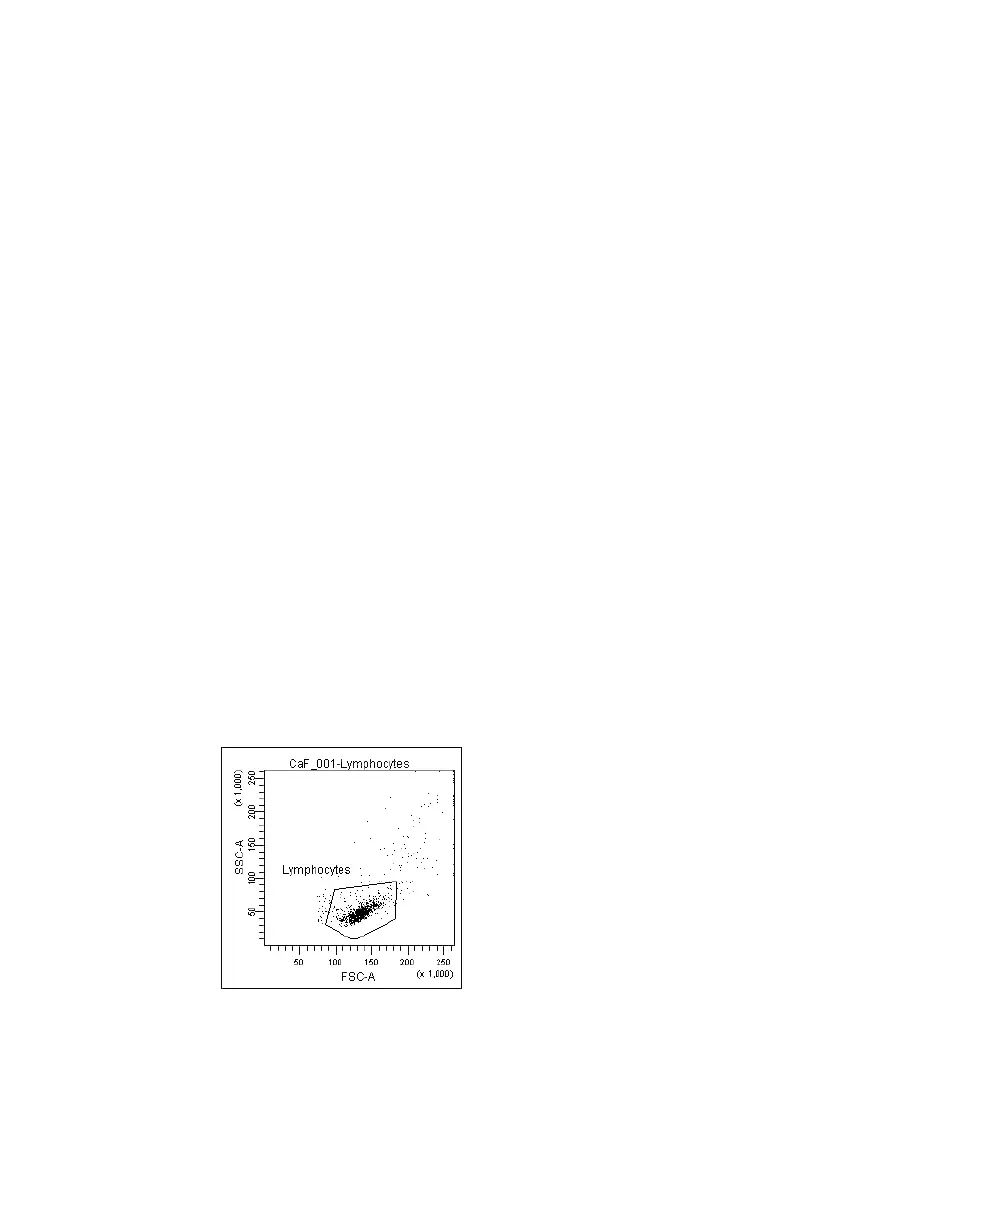
4 Adjust the FSC and SSC voltages to place the lymphocytes on scale in the
FSC vs SSC dot plot.
5 Adjust the FSC threshold to remove debris without cutting into the
lymphocyte population.
6 Draw a gate around the lymphocytes.
7 Create a population hierarchy view and rename the population
Lymphocytes.
Figure 5-2 Lymphocyte gate
LSR2.book Page 94 Tuesday, April 25, 2006 3:34 PM