Chapter 5: Calcium Flux 95
8 Display only the lymphocyte population in the remaining two dot plots.
Select the two plots, right-click inside one of the plots and choose Show
Populations > Lymphocytes.
9 Adjust the Indo-1 (Violet)-A and the Indo-1 (Blue)-A voltages to optimize
the signal.
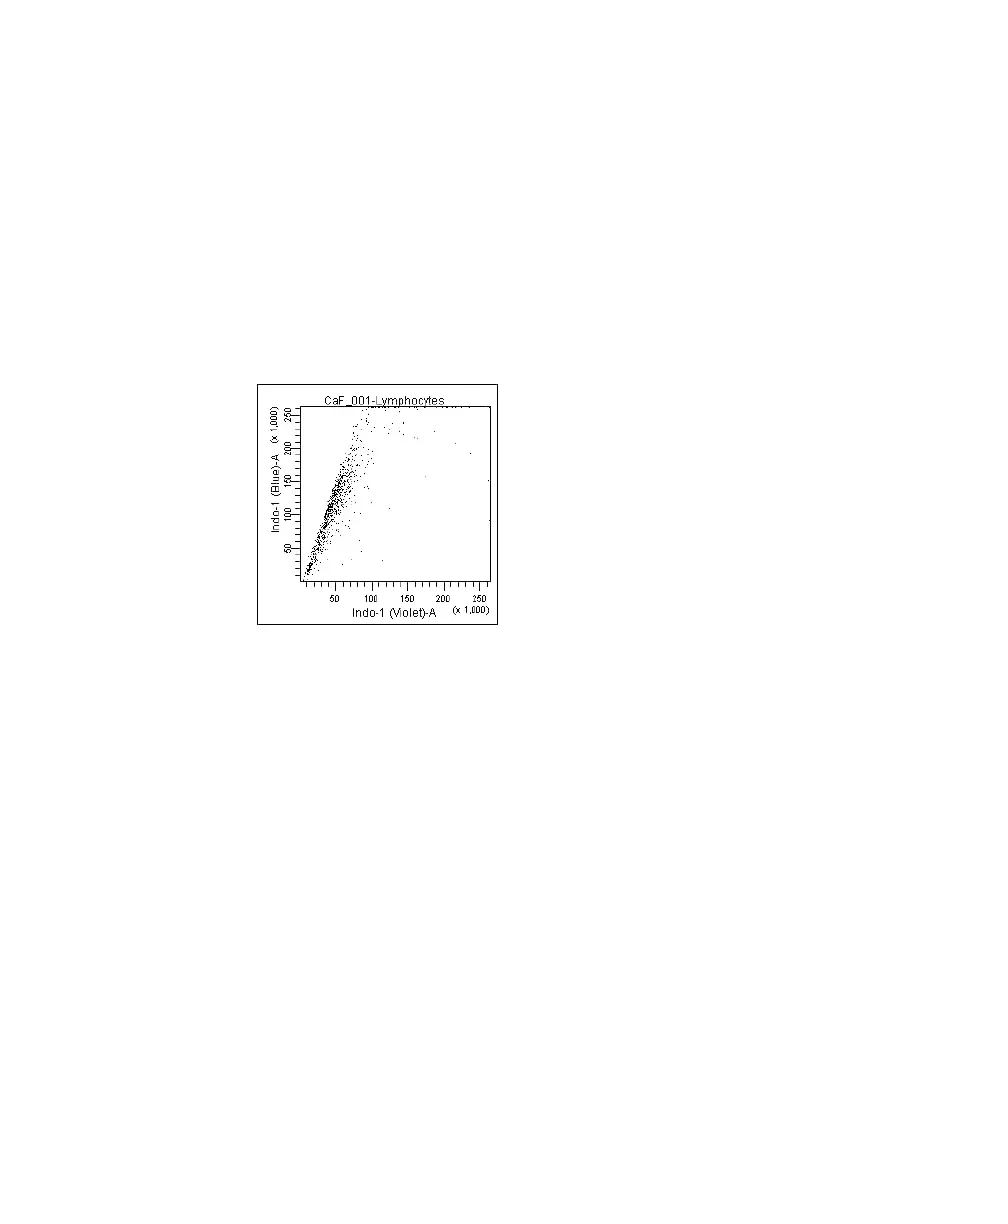
The signal, when displayed in the plot, should resemble that of Figure 5-3.
Figure 5-3 Optimized Indo-1 signal
10 Set the mean of the ratio parameter to about 50,000.
• Select the CaF_001 tube in the Browser and click the Ratio tab in the
Inspector.
• Adjust the value in the Scaling (%) field (a higher percentage will raise
the mean) until the mean of the ratio parameter is about 50,000 (use
the statistics view).
LSR2.book Page 95 Tuesday, April 25, 2006 3:34 PM