Safety Information
T3300 Diagnostic Ultrasound System | 21 | B00601-010 4/10/17
7.5 MHz frequency, the power will be attenuated by 0.0750 at 5 cm, or 0.3 x 7.5 x 5 = -11.25 dB. The
De-rated Intensity is also referred to as ‘.3’ at the end (e.g. I
spta.3
).
I’ = I * R
F Where I’ is the intensity in soft tissue, I is the time-averaged intensity measured in water.
2.9.1 TI
TI is defined as the ratio of the In Situ acoustic power (W.3) to the acoustic power required to raise
tissue temperature by 1°C (W
deg),
TI = W.3 / W
deg
Three TIs corresponding to soft tissue (TIS) for abdominal; bone (TIB) for fetal and neonatal
cephalic; and cranial bone (TIC) for pediatric and adult cephalic, have been developed for
applications in different exams. An estimate of the acoustic power in milliwatts necessary to produce
a 1°C temperature elevation in soft tissue is:
W
deg
= 210 / fc
For model 1 to 4, where fc is the center frequency in MHz.
W
deg
= 40 · K · D
For model 5 and 6, where K (beam shape factor) is 1.0, D is the aperture diameter in cm at the depth
of interest.
2.9.2 MI
Cavitation is more likely to occur at high pressures and low frequencies in pulse ultrasound wave in
the tissue, which contains a bubble or air pocket (for instance, the lung, intestine, or scan with gas
contrast agents). The threshold under optimum conditions of pulsed ultrasound is predicted by the
ratio of the peak pressure to the square root of the frequency.
MI = Pr’ / sqrt(fc)
Pr’ is the de-rated (0.3) peak rare-fractional pressure in Mpa at the point where PII is the maximum,
and fc is the center frequency in MHz. PII is the Pulse Intensity Integral that the total energy per unit
area carried by the wave during the time duration of the pulse. The peak rare-fractional pressure is
measured in hydrophone maximum negative voltage normalized by the hydrophone calibration
parameter.
2.9.2.1 Display Guideline
Thermal Index (TI) consists of two indices: soft tissue (TIS) and bone (TIB). TIB is only displayed in
non-scanning modes, such as M-mode, PW mode and CW mode. TIS is displayed in all scan
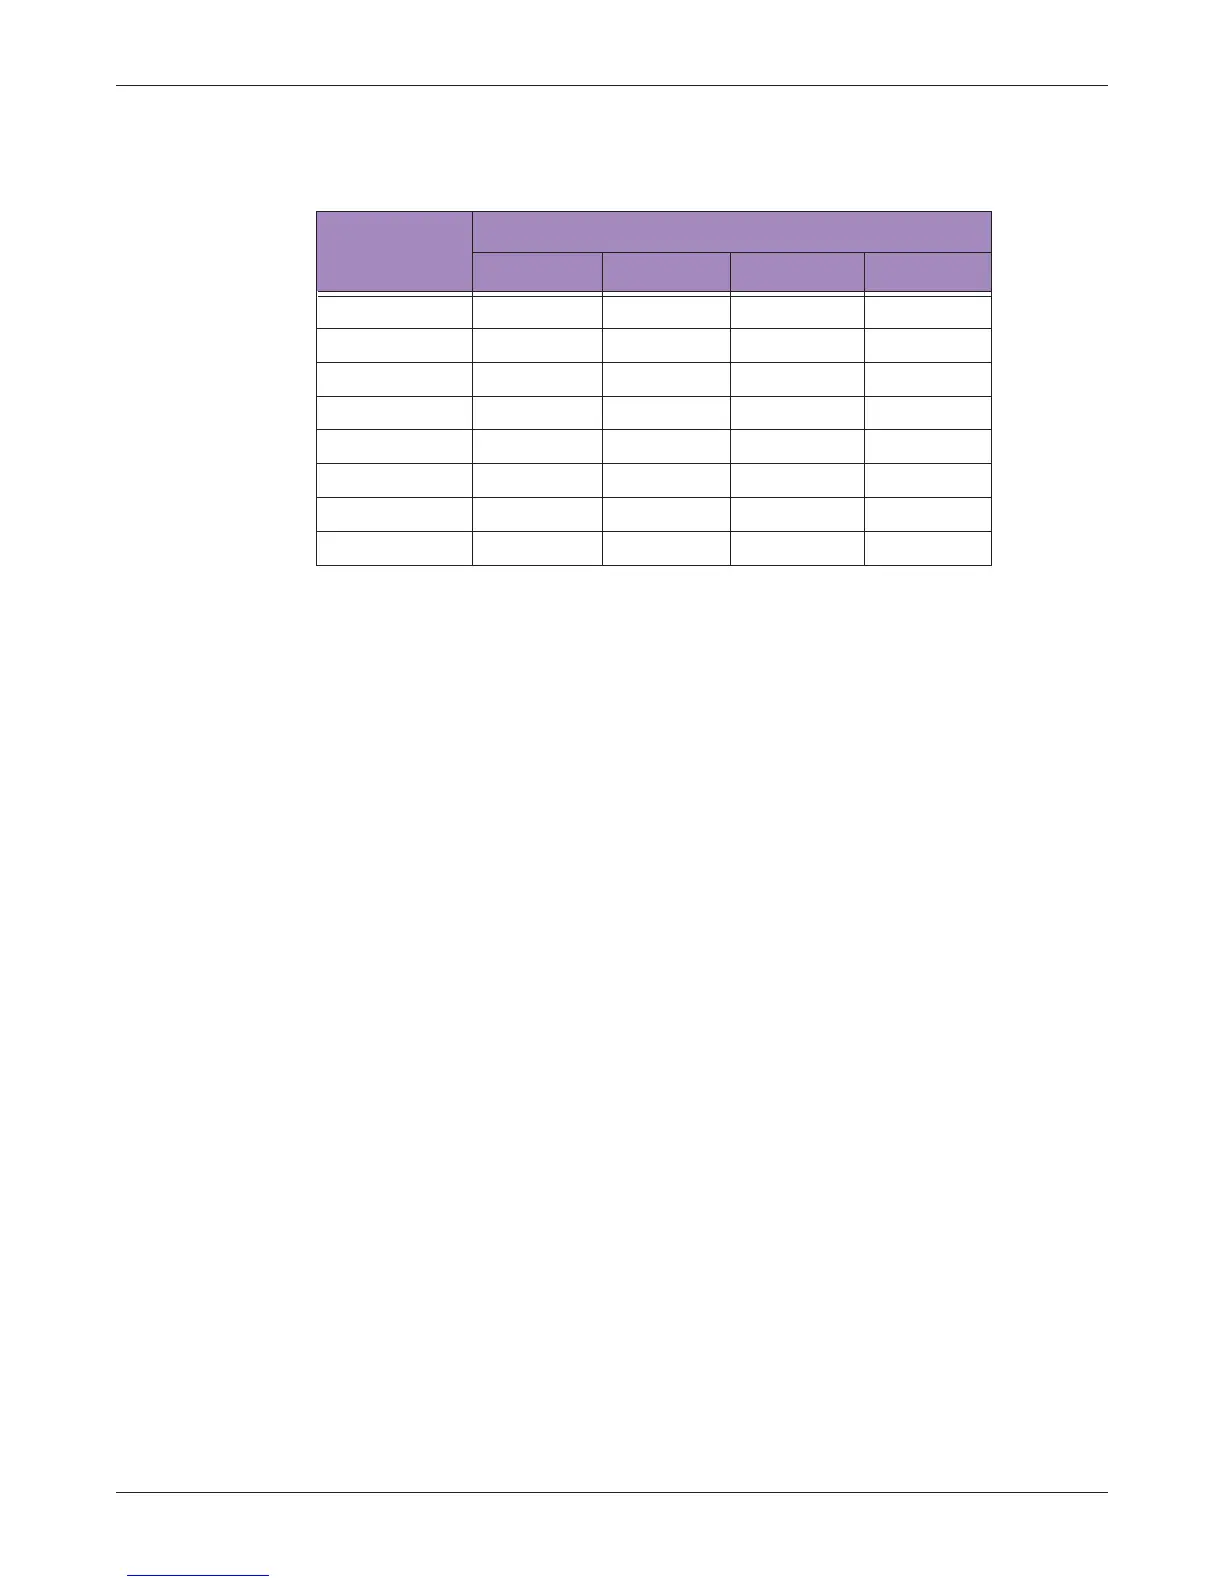
Table 11
Distance (cm)
Frequency (MHz)
1 3 5 7.5
1 0.9332 0.8128 0.7080 0.5957
2 0.8710 0.6607 0.5012 0.3548
3 0.8128 0.5370 0.3548 0.2113
4 0.7586 0.4365 0.2512 0.1259
5 0.7080 0.3548 0.1778 0.0750
6 0.6607 0.2884 0.1259 0.0447
7 0.6166 0.2344 0.0891 0.0266
8 0.5754 0.1903 0.0631 0.0158