S10/S12/S10A/S12A Patient Monitor User’s Manual
8-19
When these situations exist, you should consider turning off the ST segment
analysis function.
8.7.3. Displaying ST parameter
The method of displaying ST parameters and waveforms is as follows:
1. Enter the 【Screen Layout】 page in one of the following ways:
Select 【 Screen Setup 】 quick keyselect 【 Screen Layout 】
submenu.
Select 【Main Menu】 quick keyfrom 【Display】 column to select
【Screen Layout】.
2. Click on the location in the parameter area where ST parameters need to be
displayed, and select 【ECG】→【ST】. Depending on the type of lead you
are using, the ECG parameter area displays different ST parameters:
When using 3-lead monitoring, an ST parameter value is displayed in
the ECG parameter area but not in the ST parameter area.
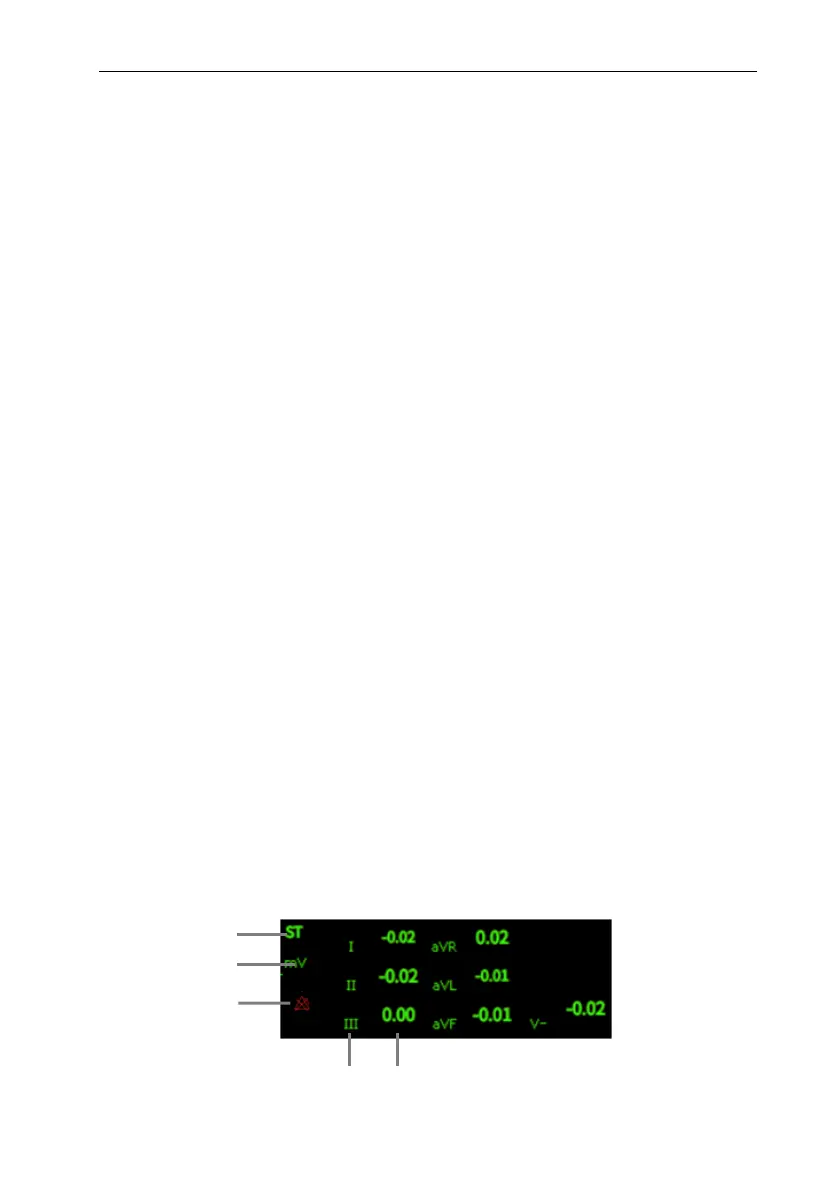
When using 5-lead monitoring, the ST parameter area displays 7 ST
parameter values, namely ST-I, ST-II, ST-III, ST-aVR, ST-aVL,
ST-aVF and ST-V respectively.
When 6-lead monitoring is used, the ST parameter area shows the same
values of 8 ST parameters, namely ST-I, ST-II, ST-III, ST-aVR,
ST-aVL, ST-aVF, ST-Va and ST-Vb.
When 12-lead monitoring is used, the ST parameter area displays 12 ST
parameter values, namely ST-I, ST-II, ST-III, ST-aVR, ST-aVL,
ST-aVF, ST-V1, ST-V2, ST-V3, ST-V4, ST-V5, and ST-V6.
Take 5-lead as an example, the ST parameter area is shown as follows:
1
2
4
5
3