Section 5. Real-Time Tools
A mixed-array datalogger’s final storage data must be collected
by LoggerNet before it can be displayed.
NOTE
When a value declared as a Long is being graphed, –2147483648
(the most negative long value) is used to indicate NAN (Not A
Number).
NOTE
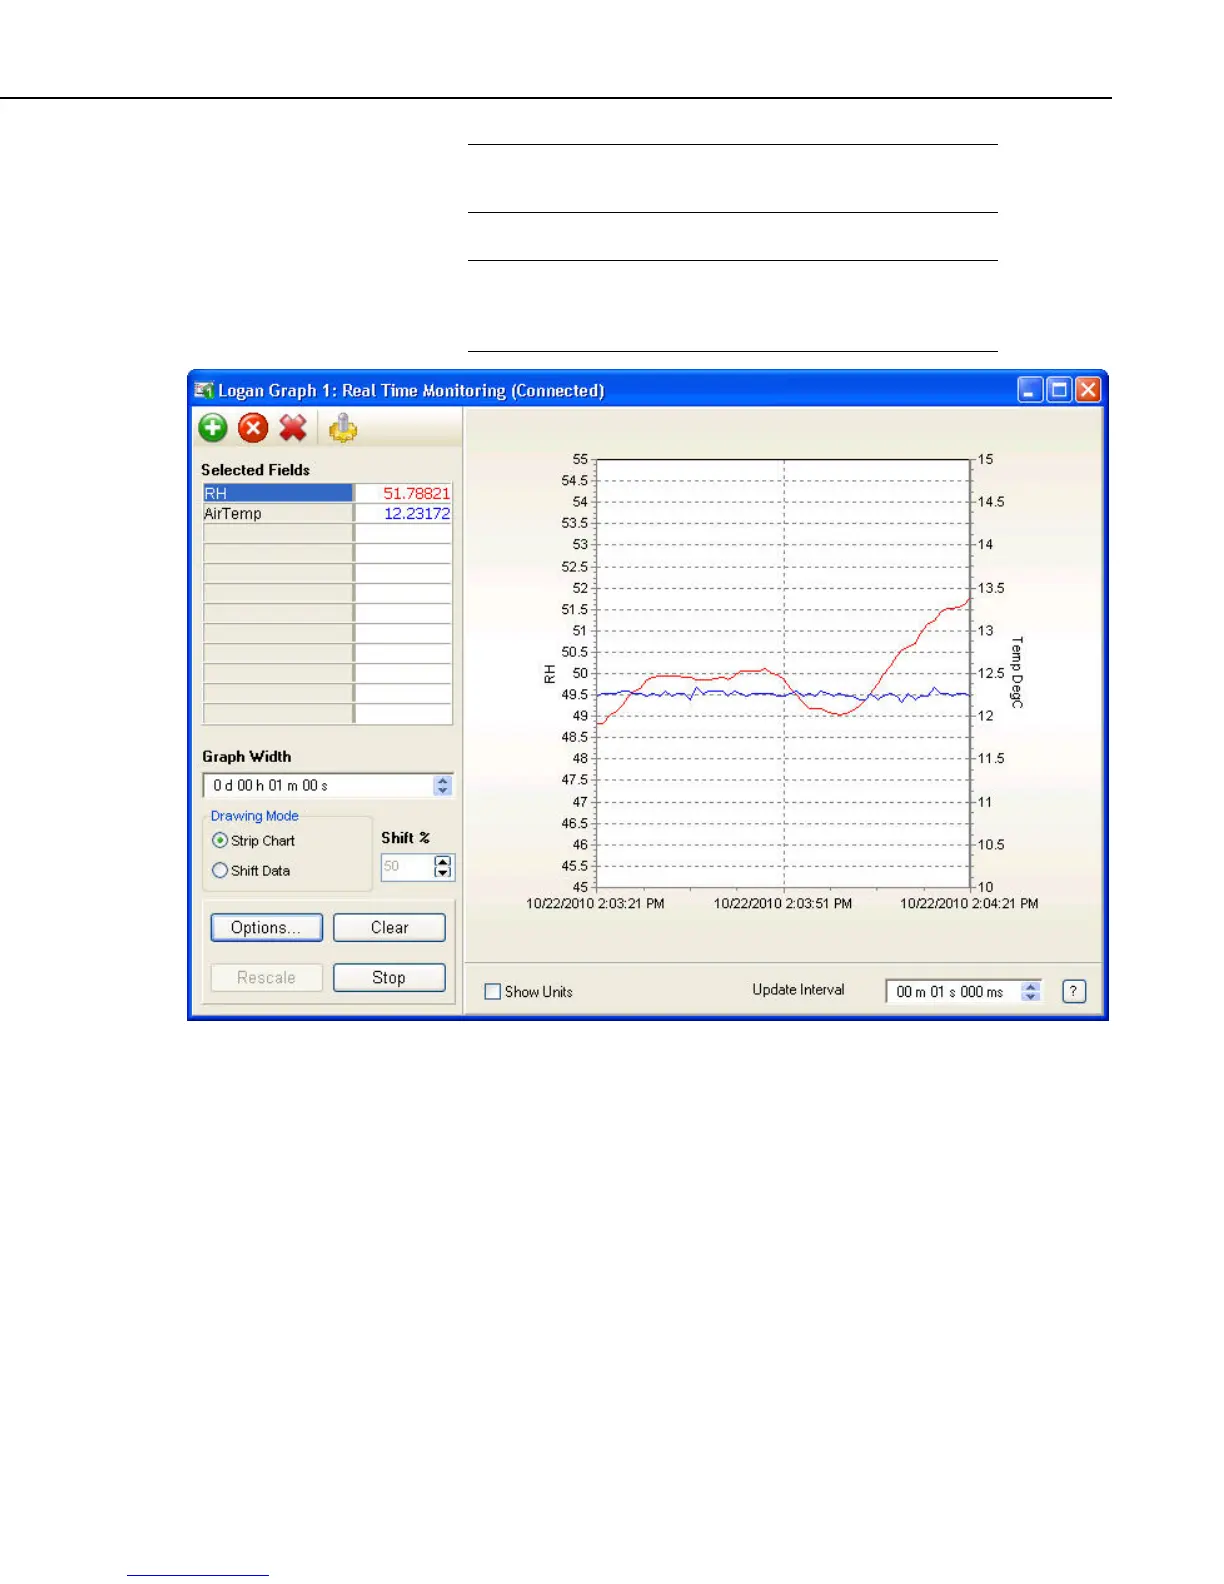
5.1.7.3.1 Displaying Values on a Graph
A graph is initially blank when opened; the fields to be plotted must be
selected. Press the Add button to bring up the Add Selection dialog box that
lists the data fields for the available datalogger tables or final storage arrays.
Up to twelve data fields can be graphed simultaneously. Data values are added
to a graph in the same way they are added to the numeric display. Refer to the
discussion above about adding values to a display using the Add Selection
dialog box.
5-19