Section 8. Working with Data Files on the PC
8.1.7.1 Line Graph
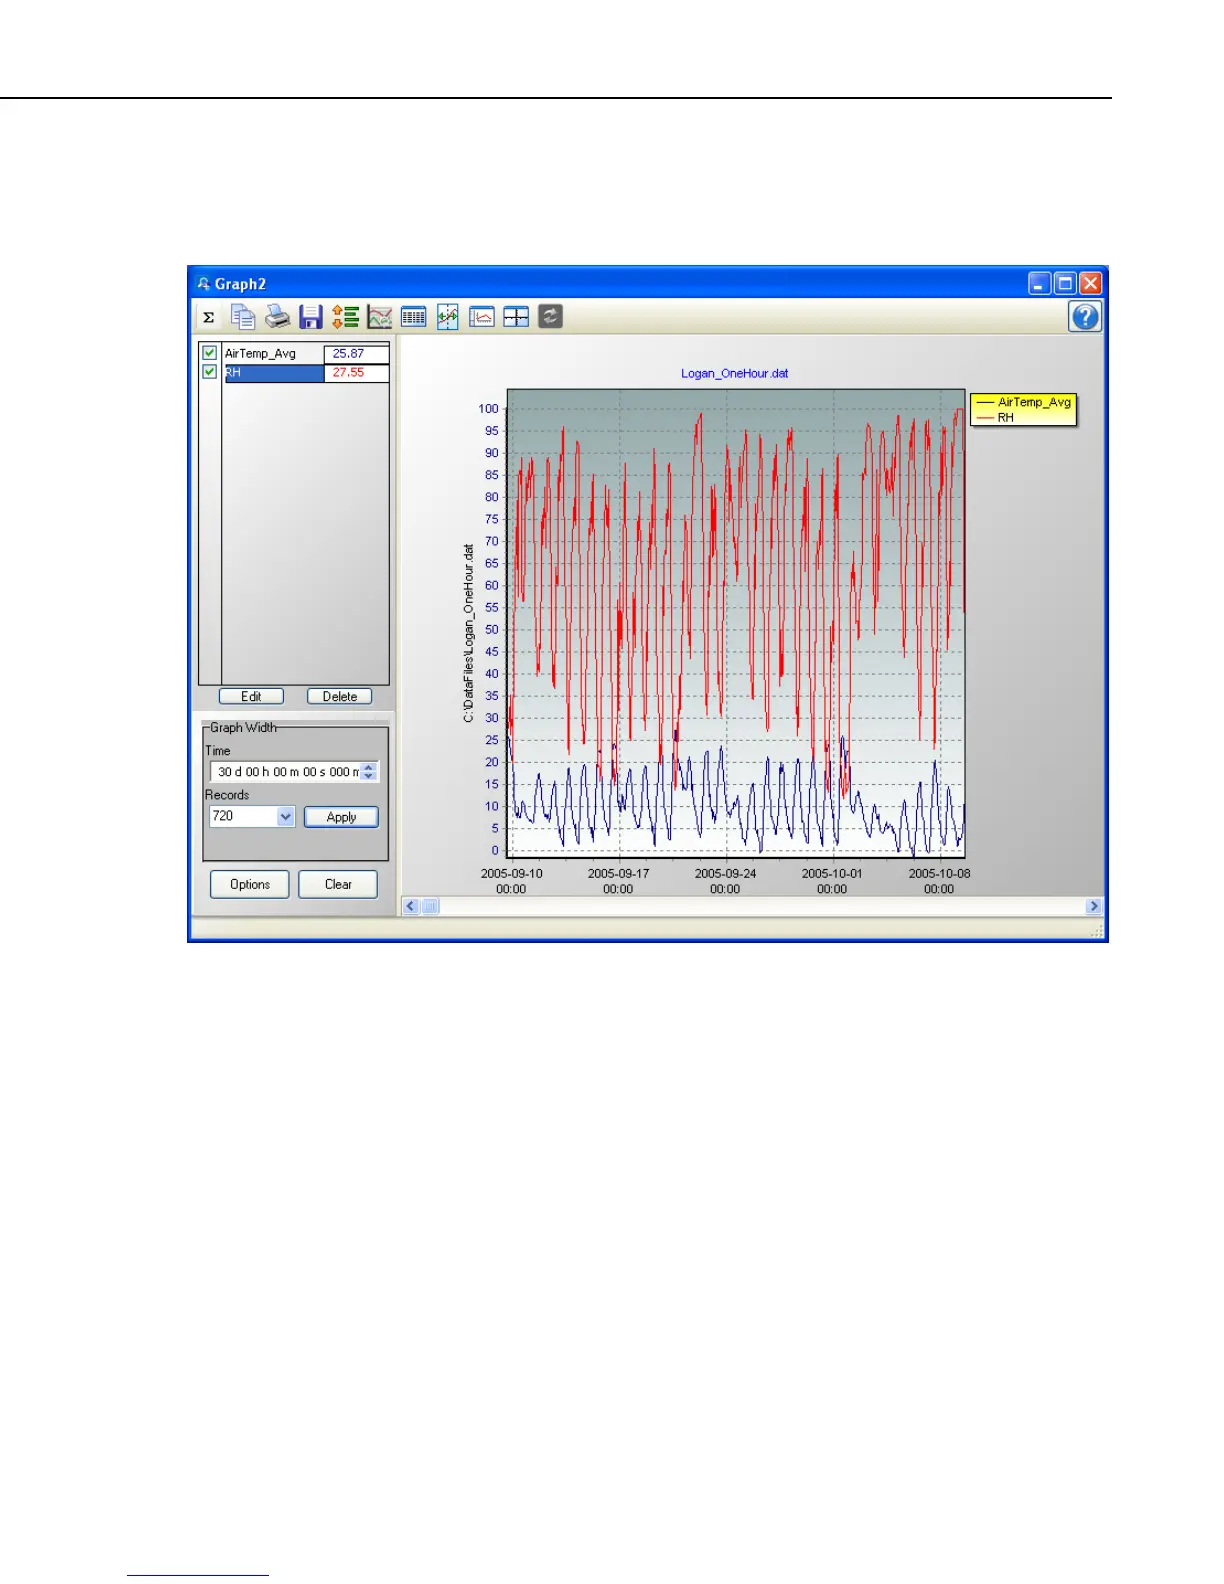
From the Line Graph screen, you can graph data values on the y-axis against
their timestamps on the x-axis.
8.1.7.1.1 Selecting Data to be Graphed
Data value(s) are added to a graph by clicking the column heading(s) in the
data panel with a single mouse click. The selection will be highlighted and
will automatically be added to the currently selected graph. (The currently
selected graph is indicated on the main View Pro toolbar, and can be changed
from the drop-down list.)
Multiple columns can be added by holding the Ctrl key and dragging the
mouse pointer over the column headings. A partial column can be added by
dragging the mouse pointer over the desired values. (Note that once a partial
column is selected, it can be extended by holding the Shift key and clicking at a
point below the current selection. The selection will be extended to that point.)
Multiple partial columns can be added by holding the Ctrl key and dragging the
mouse pointer over the desired values.
Data from multiple data files can be displayed in a single graph. This is done
by opening multiple data files and selecting data to be graphed as described
above. This may be useful when comparing data from multiple datalogger
stations.
8-15