Section 8. Working with Data Files on the PC
8.1.7.4 Rainflow Histogram
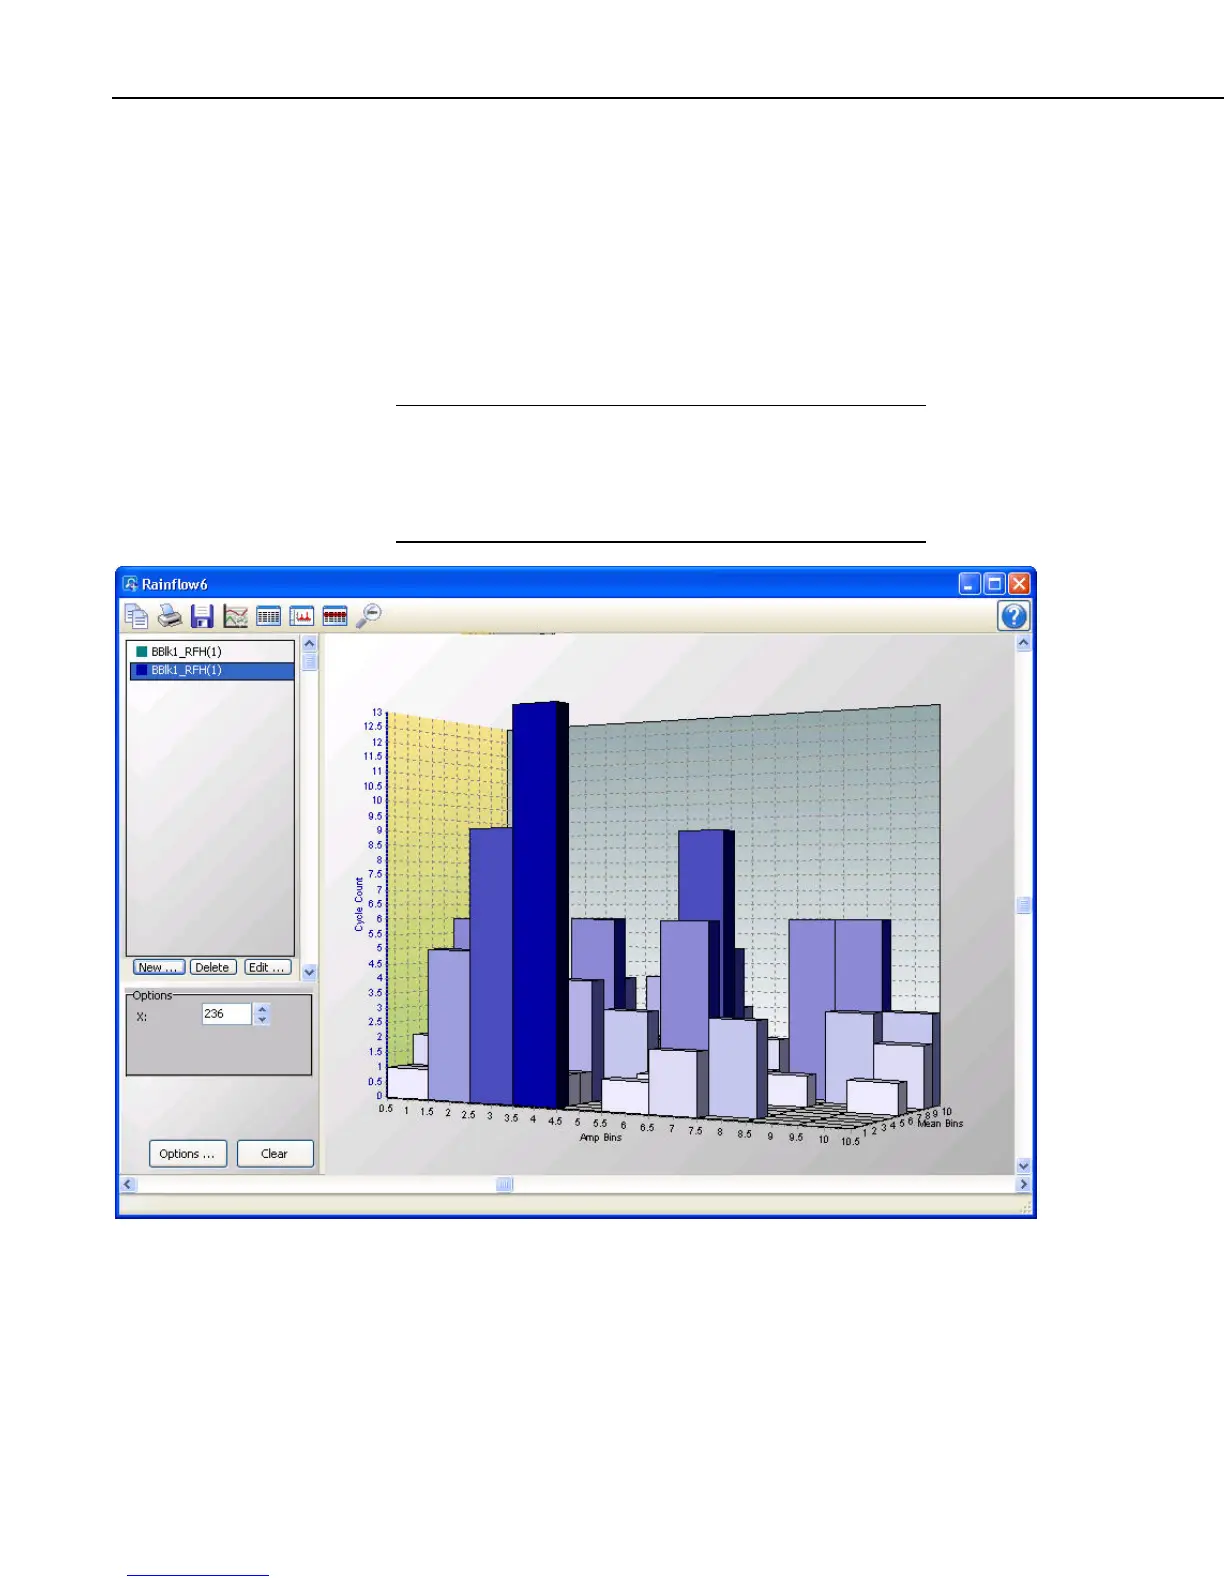
From the Rainflow Histogram screen, you can view rainflow histogram data.
The Rainflow Histogram button on the toolbar will be enabled if there is at
least one valid rainflow histogram in the currently selected data file.
A Rainflow Histogram is a 3D representation based on the rainflow counting
algorithm of Endo and Matsuishi which was first published in 1968. These
diagrams can be used to monitor fatigue levels of structures under stress such
as components of a large bridge.
ViewPro does not create rainflow histogram data from time
series information. It only displays rainflow histogram data
contained in a *.DAT file. Rainflow Histogram data in the
*.DAT file is created by using the CRBasic Rainflow instruction
in a CRBasic program Data Table.
NOTE
8-24
 Loading...