Section 8. Working with Data Files on the PC
Show Table. Brings the main View Pro window in front of other
windows, making the data file(s) visible.
Show/Hide Gradient. A toggle button that turns on and off the
gradient background of the Histogram. It may be useful to hide the
gradient, when printing the Histogram.
Modify Selection. Brings up the Histogram Setup dialog box from
which you can change the options for the selection.
Undo Zoom. Returns the Histogram to its original state after
zooming.
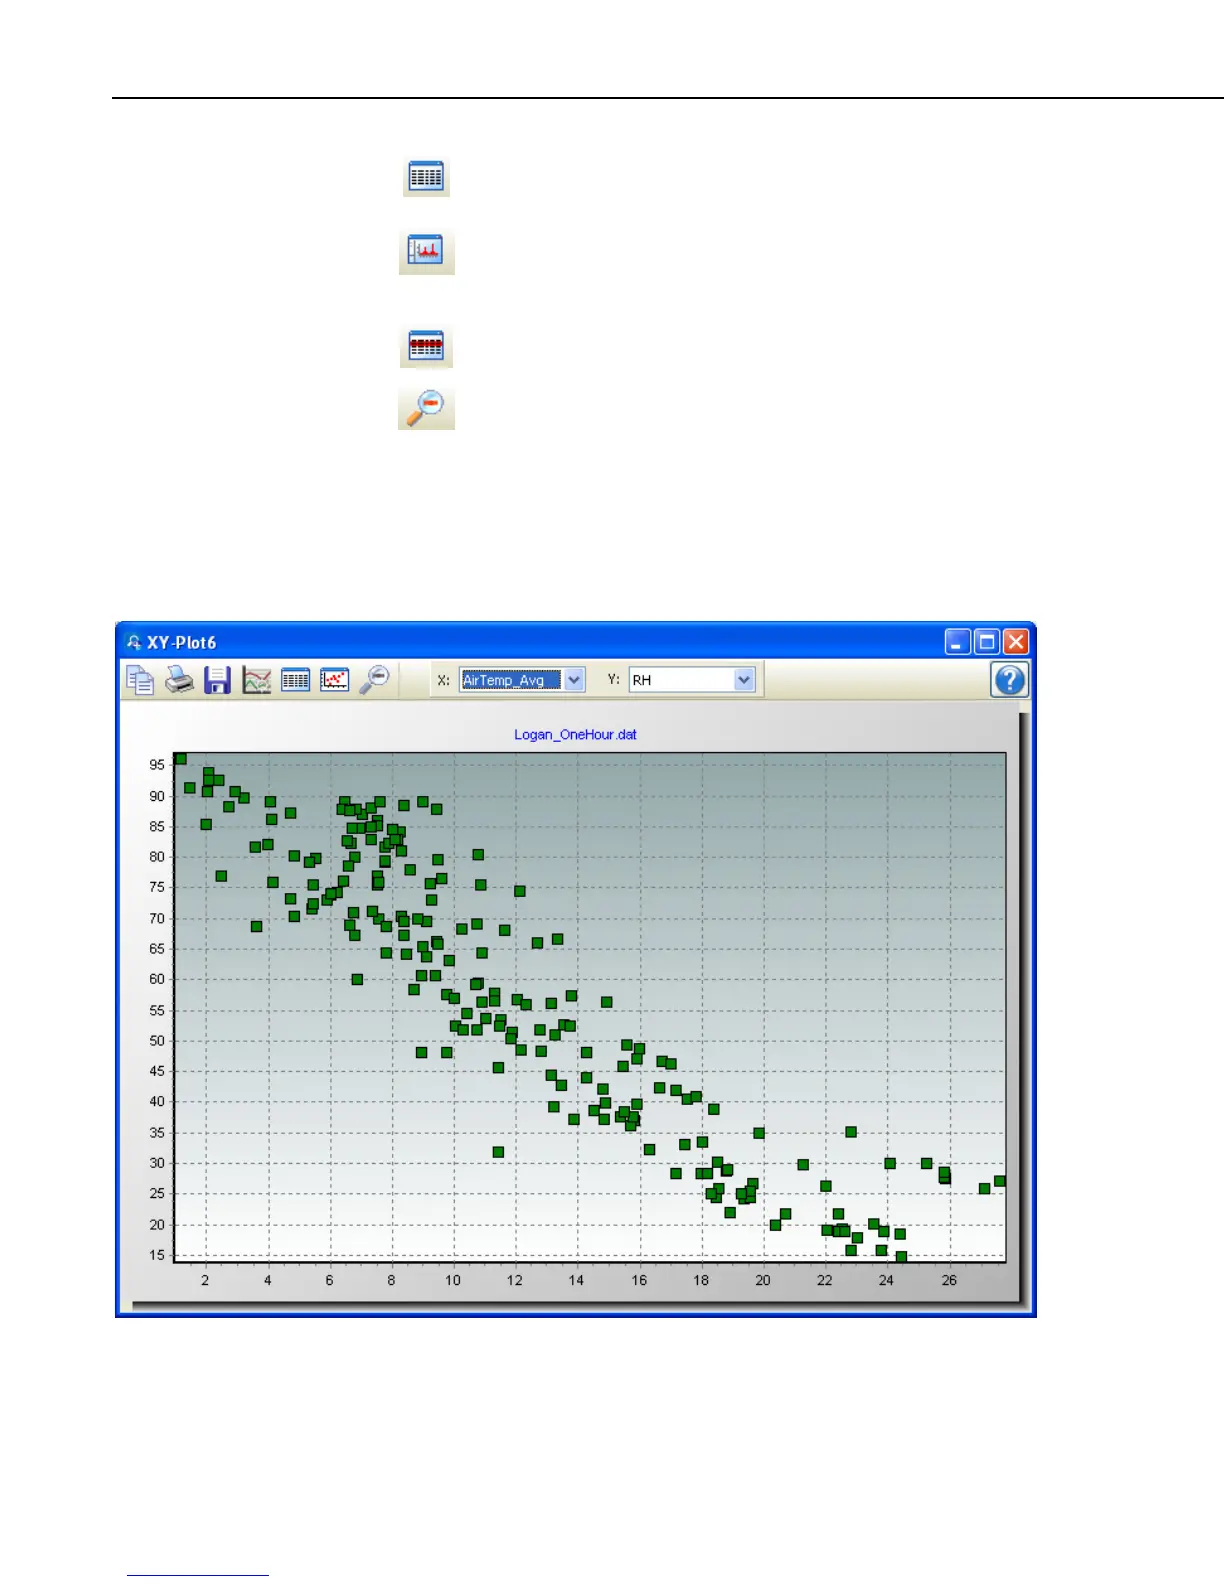
8.1.7.3 XY Plot
From the XY Plot screen, you can graph a data value on the y-axis against a
different data value on the x-axis. The user specifies what will be used for both
the X axis data value and the Y axis data values. Each Y axis data value is
plotted against the X axis data value with the identical timestamp.
8-22