Section 8. Working with Data Files on the PC
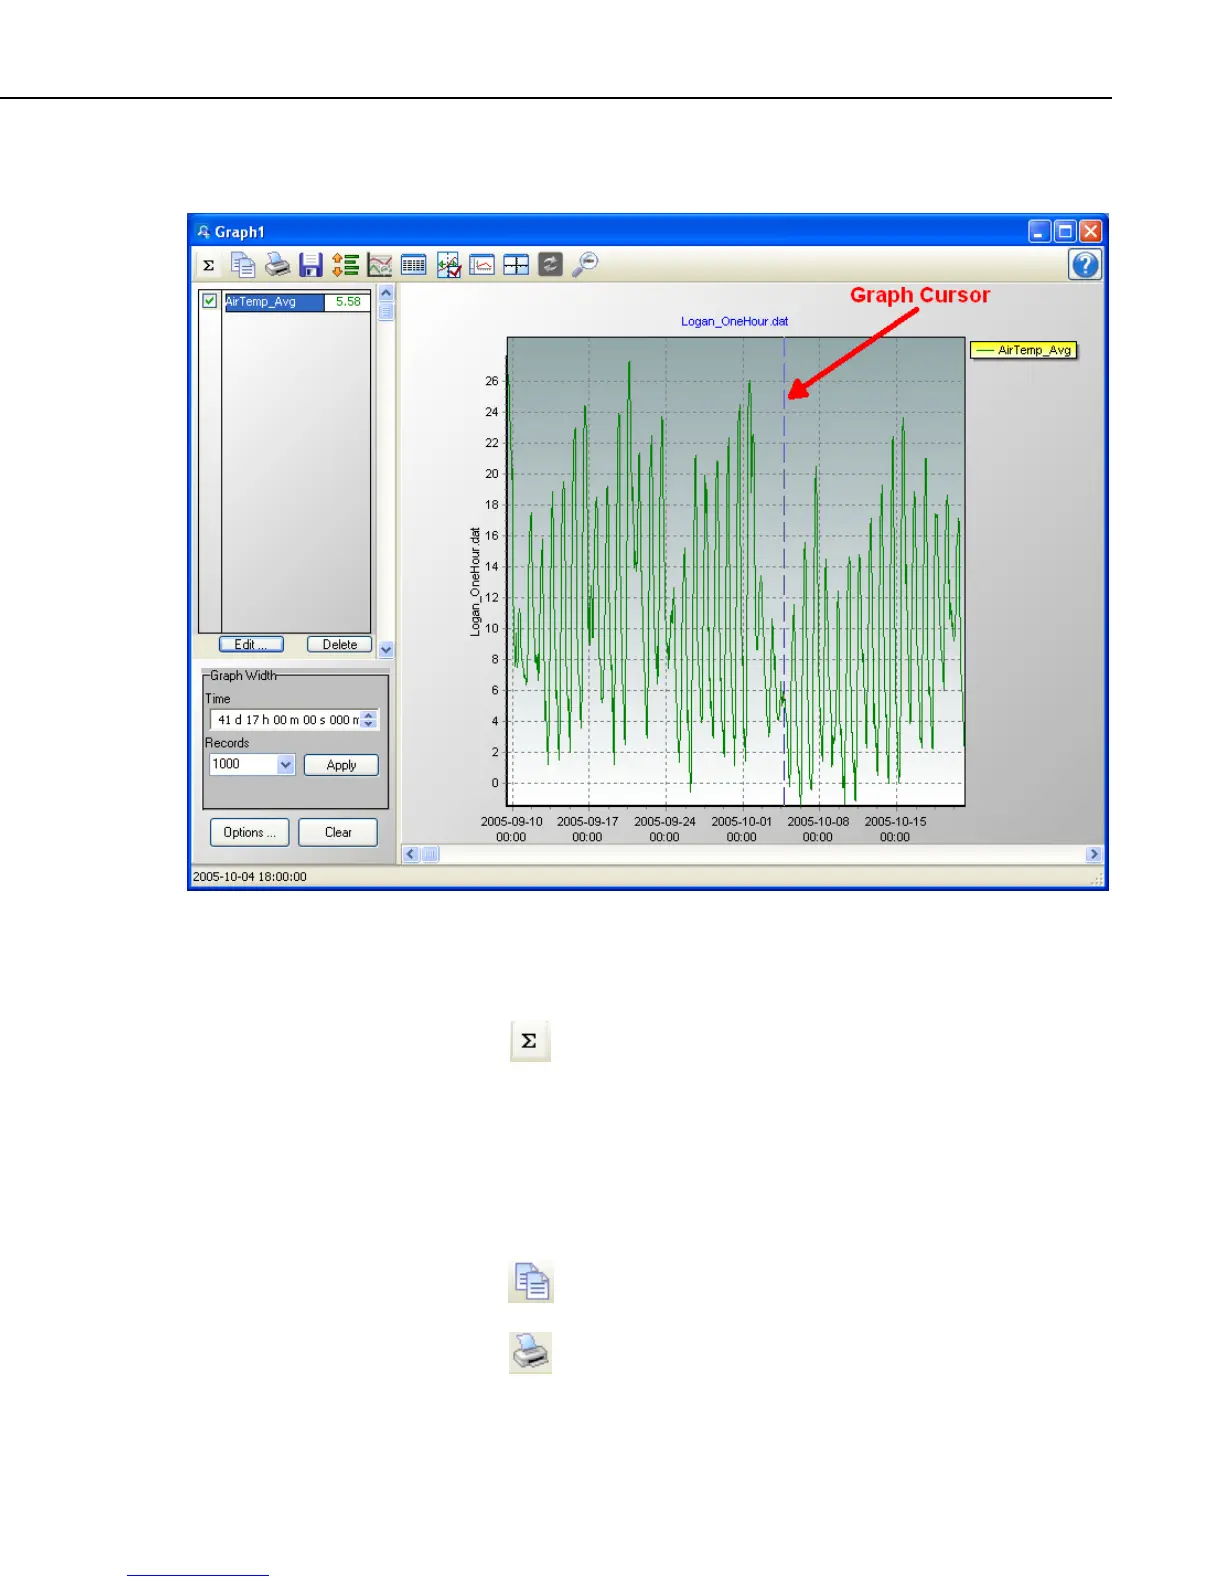
and drag the cursor across the graph. Data values at the current cursor position
will be shown in the table to the right of the graph.
8.1.7.1.5 Line Graph Toolbar
The Line Graph toolbar includes the following icons:
Statistics. Displays statistics for each trace including Average,
Standard Deviation, Minimum and Maximum. Note that these
statistics are for the data displayed in the graph. They are not
statistics for the entire column(s) of data. Note that an asterisk
next to a statistics value indicates that the trace contains one or
more bad data values (i.e., NAN, INF, etc.).
The Statistics button is disabled when a graph is in a zoomed
stated.
Copy to Clipboard. Places the graphic on the Windows
clipboard. It can then be pasted into other applications.
Print. Prints the graph. Print options can be set before printing
begins.
8-17
 Loading...