20060301
Generating Number Table Values from a Graph
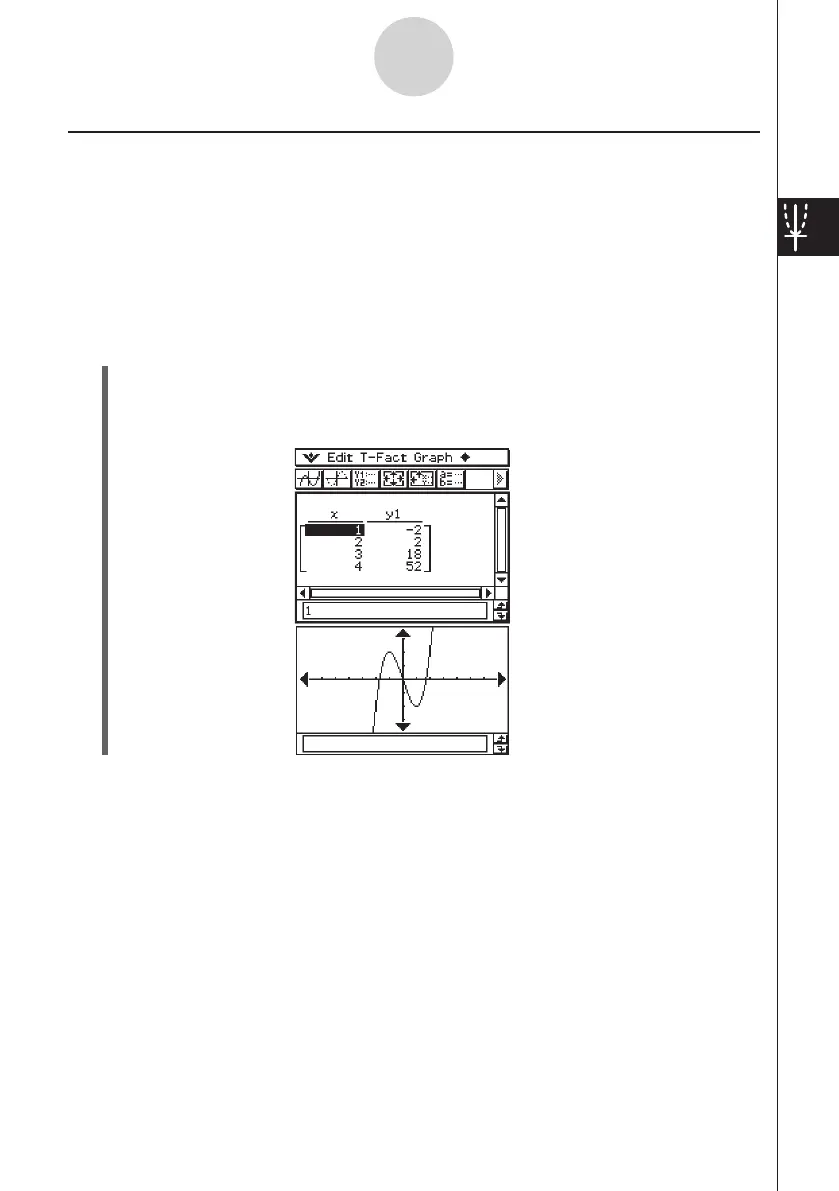
A “graph-to-table” feature lets you extract the coordinate values at the current pointer location
and input them into a table.
Example: Generate a table and graph for the expression
y
=
x
3
– 3
x
, and input the
coordinates for specific points on the graph into a table
Use the initial View Window settings (page 3-2-3).
Configure the Table Input settings shown below.
Start: 1, End: 4, Step: 1
u
ClassPad Operation
(1) Input the function
y
=
x
3
– 3
x
on the Graph Editor window.
(2) Tap
$
to graph the function.
(3) Tap
#
to generate the table.
3-7-4
Using Trace