20060301
7-4-4
Graphing Single-Variable Statistical Data
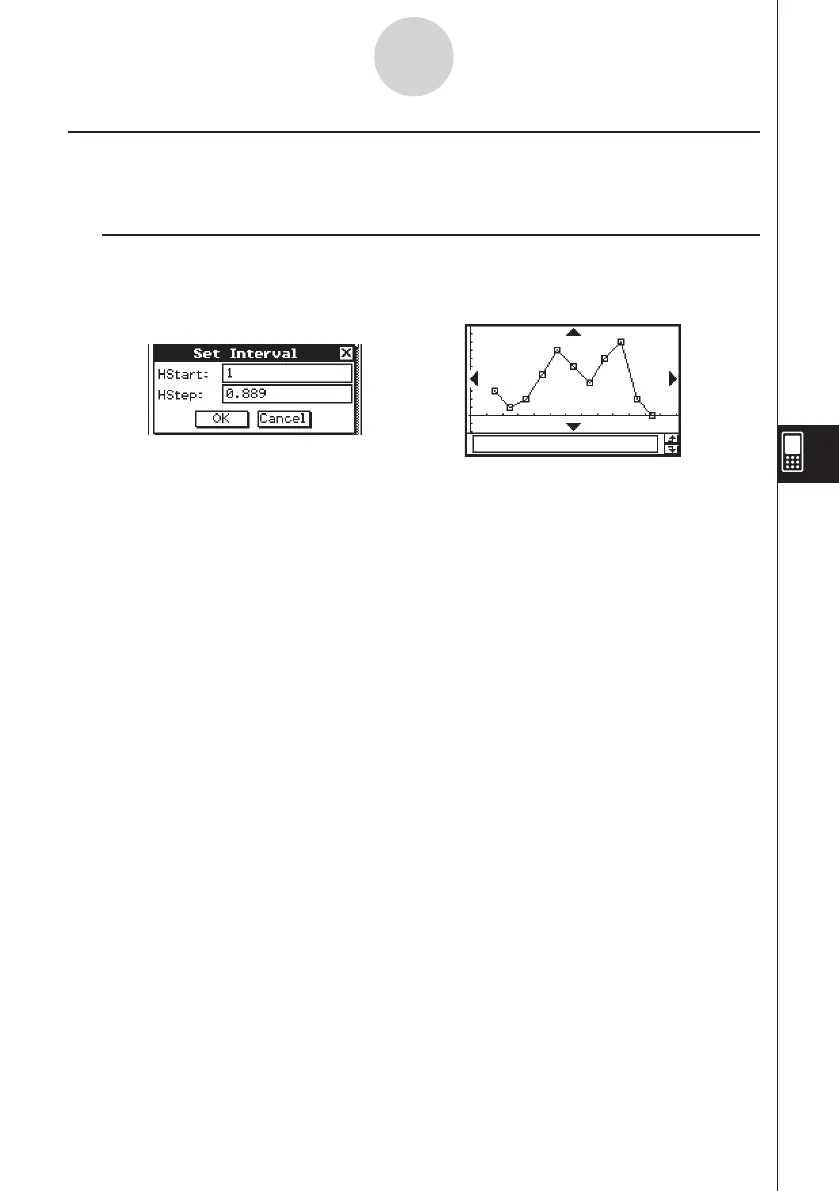
A dialog box like the one shown above appears before the graph is drawn. You
can use this dialog box to change the start value (HStart) and step value (HStep)
of the histogram, if you want.
Broken Line Graph (Broken)
In the broken line graph, lines connect the pointers that fall at the center of each histogram
bar.
k
Graph Parameter Settings (page 7-3-3, 7-3-4)
• [XList] specifies the list that contains the data to be graphed.
• [Freq] specifies the frequency of the data.
Tap [OK].
e